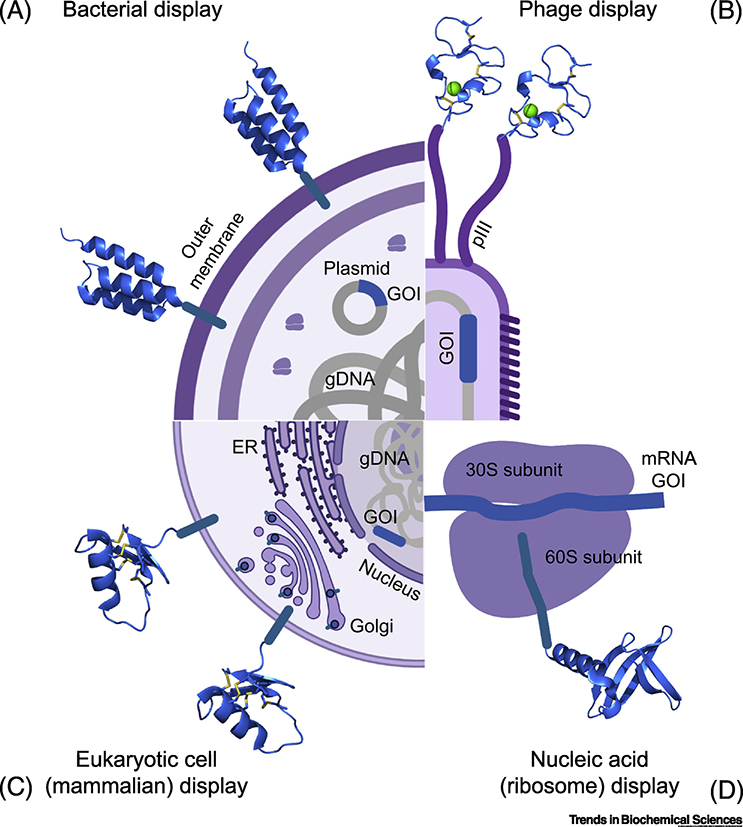
Figure 2.
Surface display screening strategies. Four techniques are highlighted: phage display (top right; M13 phage protein pIII fused to an avimer), bacterial display (top left; E. coli displaying an affibody from its outer membrane), eukaryotic cell display (bottom left; mammalian cell displaying a CDP from its plasma membrane), and nucleic acid display (bottom right; ribosome display with a nanofittin). All are variations on a theme: the miniprotein (blue ribbon structure) is tethered to an entity that contains the miniprotein’s encoding sequence (blue line labeled “GOI” for gene of interest). The miniprotein is exposed to a target protein, which is either labeled or immobilized, followed by specific collection of the complex of target, miniprotein, and its tethered entity (bringing with it the GOI). For phage and nucleic acid display, this is often done with bead-based affinity methods. For cell display, flow cytometry is commonly used via cell staining with fluorescently labeled target protein. Multiple rounds of binding, enrichment, and growth/amplification are typical. After final collection, the GOI is then sequenced, identifying the candidate target-binding miniprotein. Note: the bottom left mammalian cell is illustrated with an ER and Golgi apparatus to highlight the importance of the eukaryotic secretory pathway for proper CDP folding. gDNA: genomic DNA.

