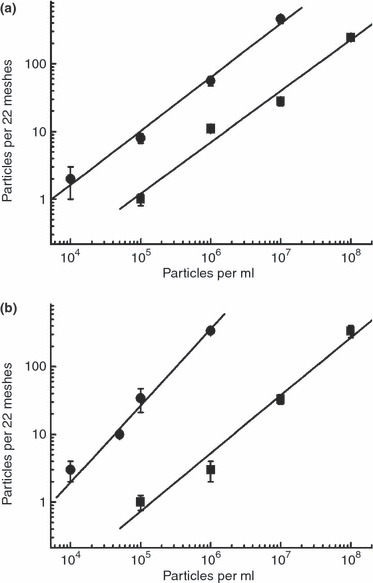
Figure 3.

Particle number on the grid in relation to concentration of the test suspension. Squares represent values of the drop‐on‐grid procedure. Circles represent values of the airfuge enrichment. (a) Spore suspension. (b) Virus suspension.(•) Airfuge and (▪) Drop‐on‐grid.
