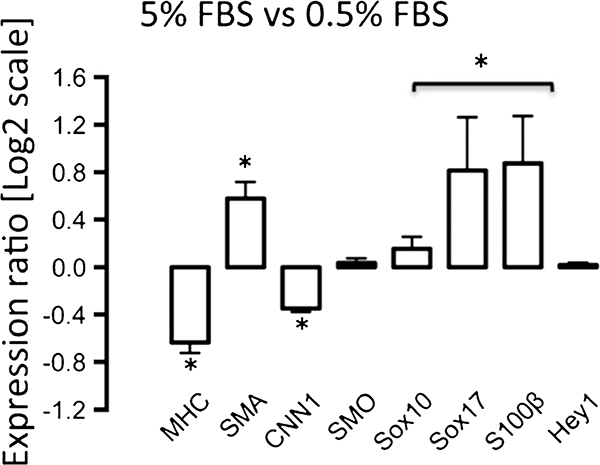
Fig. 6.
Quantitative real-time polymerase chain reaction (qRT-PCR) of neural stem cell marker and SMC differentiation marker mRNA levels in a representative vSMC line. Murine SMCs were cultured in DMEM that was serum-rich (5 % FBS) or serum-deprived (0.5 % FBS) for 3 days before mRNA levels of SMC differentiation markers SMA, MHC, CNN1 and smoothelin (SMO), of neural stem cell markers Sox10, Sox17 and S100β and of the Notch target gene Hey1 were measured by qRT-PCR. GAPDH was used to normalize gene expression. The Ct values were obtained and analysed by using the Relative Expression Software Tool (ReST) to determine the relative levels of transcripts. Data are means± SEM and are representative of three independent wells. *P<0.05 when compared with 0.5 % FCS

