
Figure 1. Share of Employment, Payroll, and Business Establishments in Goods-Producing Industries between 1987–2014.
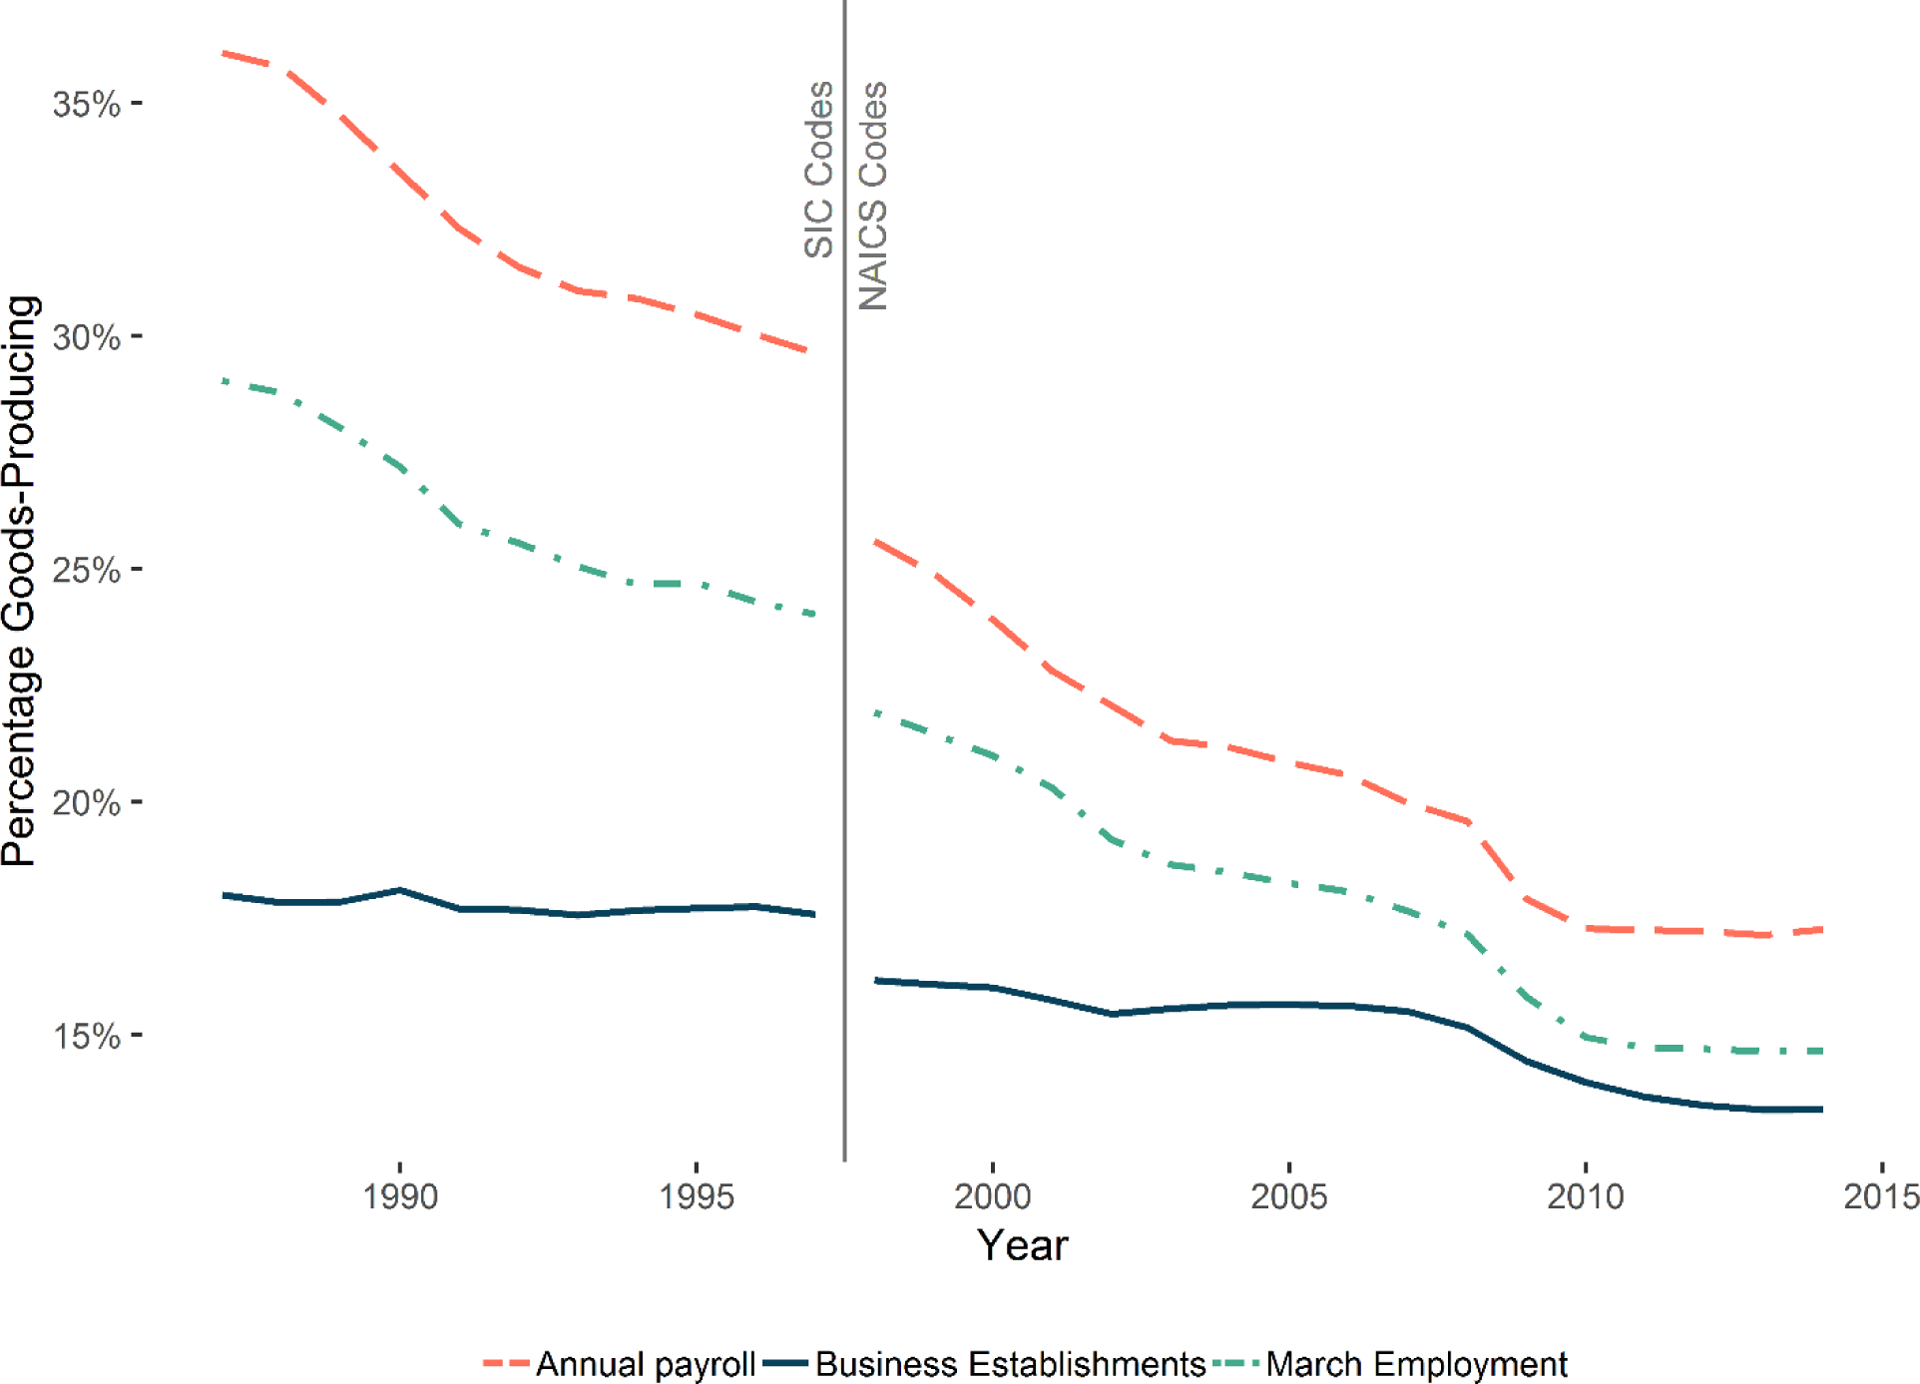
Notes: Data from U.S. Census Bureau’s County Business Pattern (CBP) program. Industry classification codes changed in 1998. Dashed lines (1987–1997) are based on Standard Industry Codes (SIC) goods-producing industries; Solid lines (1998–2014) based on North American Industry Classification System (NAICS) goods-producing industries. Calculations are for all metropolitan statistical areas.