
Figure 3. Average Total Fertility Rate (TFR) for all 381 Metropolitan Statistical Areas between 1990–2014 by Race/Ethnicity.
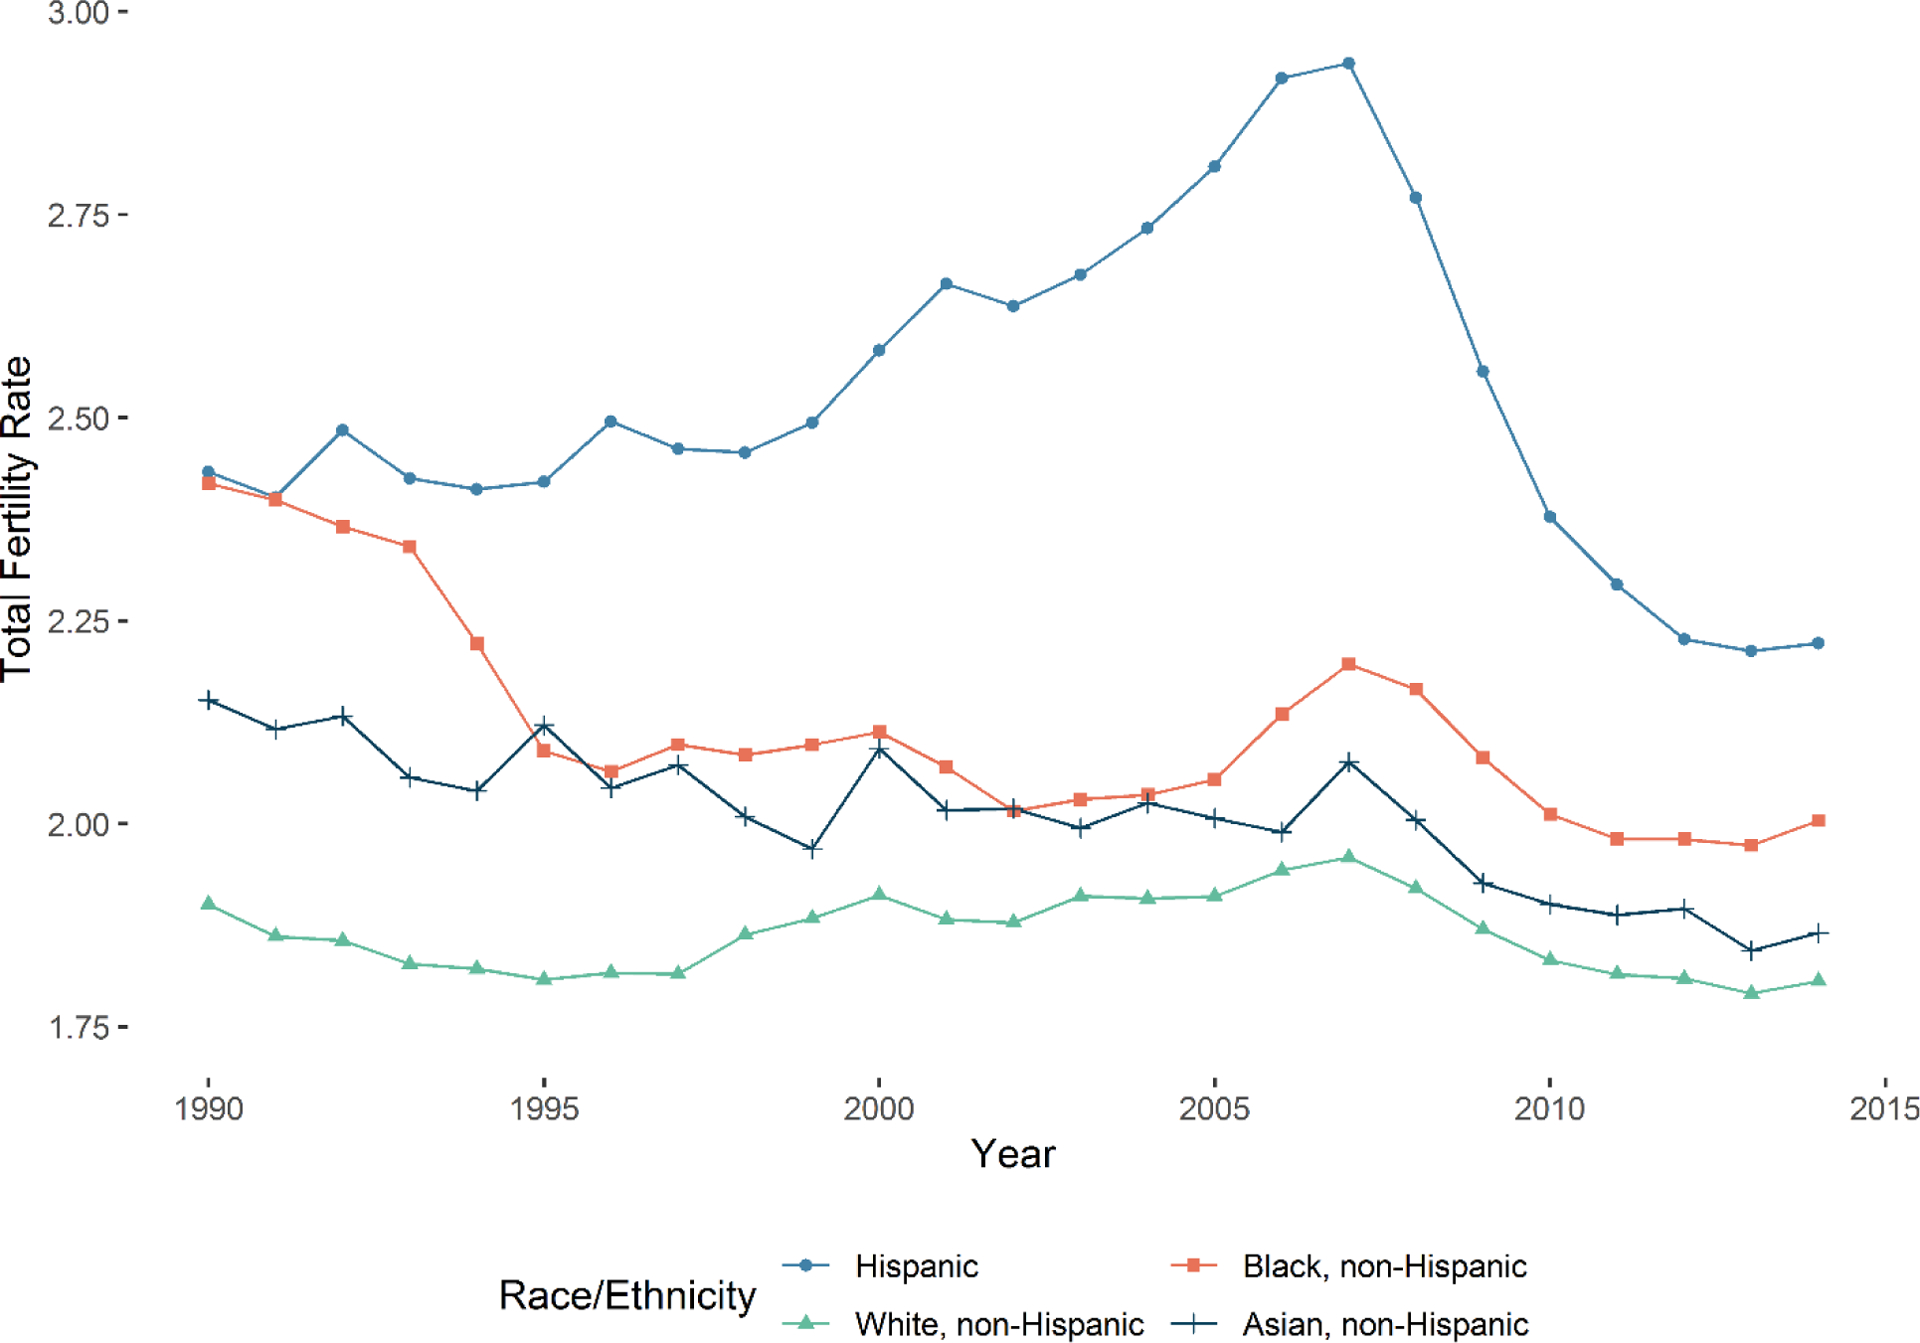
Notes: Calculated using birth data from restricted-use NCHS Natality Detail Files (1990–2014) and female population data from NCHS bridged-race population estimates. See Online Appendix Figure S2 for TFR by race/ethnicity for entire U.S. metro population.