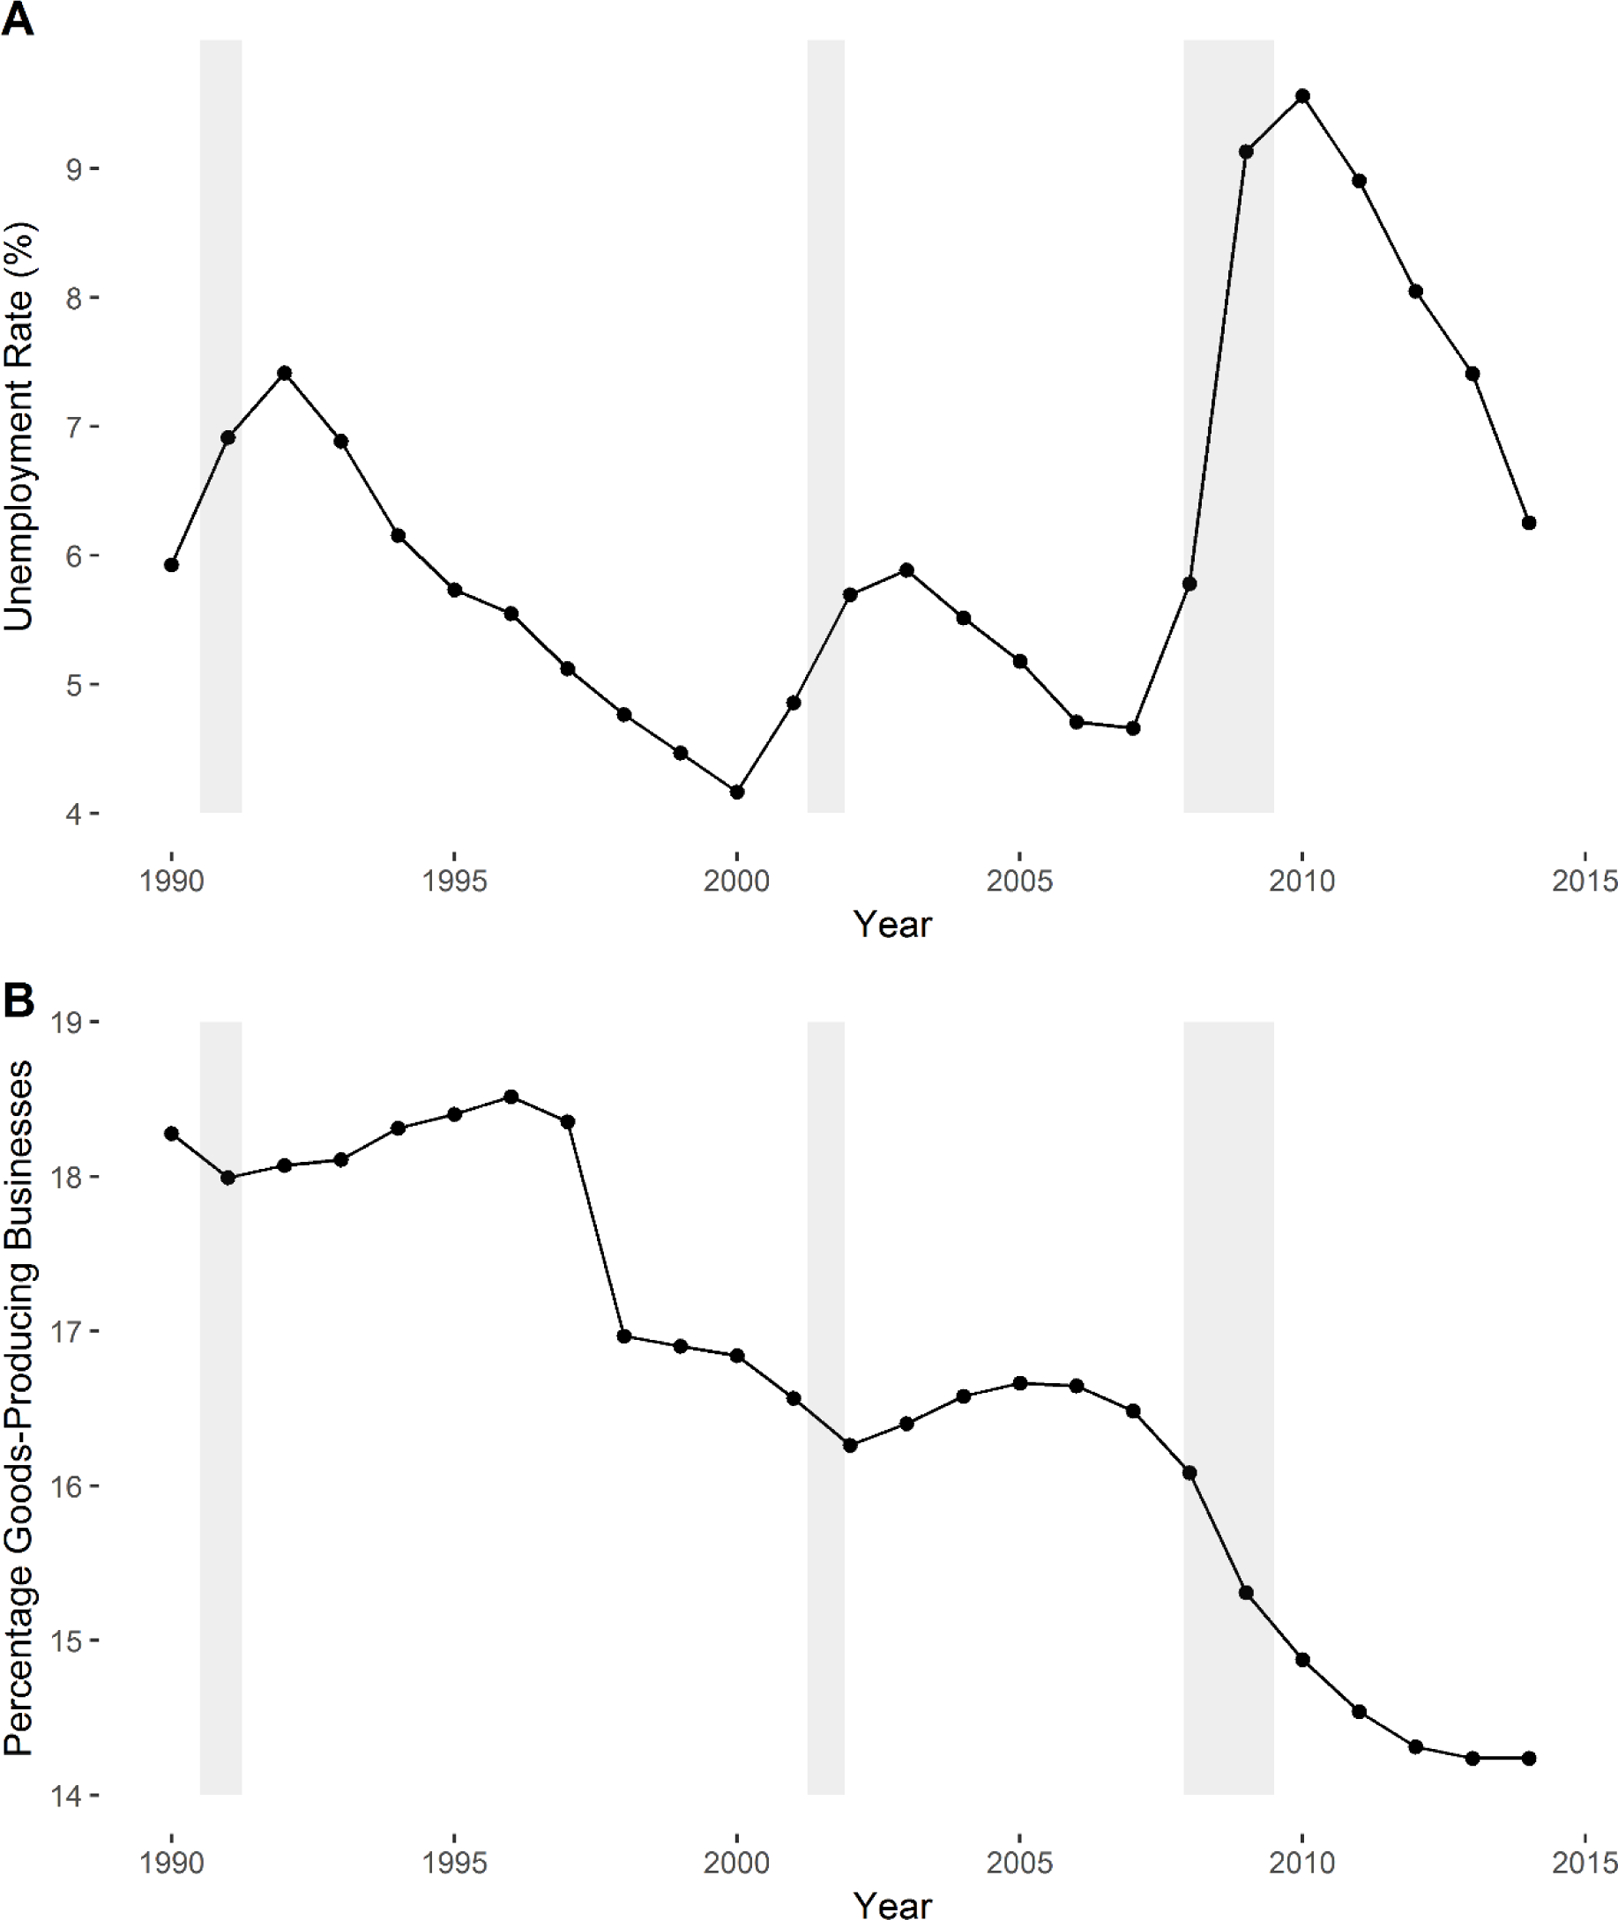
Figure 4. Average (A) Unemployment Rate and (B) Percentage of Goods-Producing Businesses for all 381 Metropolitan Statistical Areas between 1990–2014.

Note: Shaded areas represent NBER designated recessionary periods (http://www.nber.org/cycles.html): (1) July 1990-March 1991, (2) March 2001-November 2001, and (3) December 2007-June 2009.
