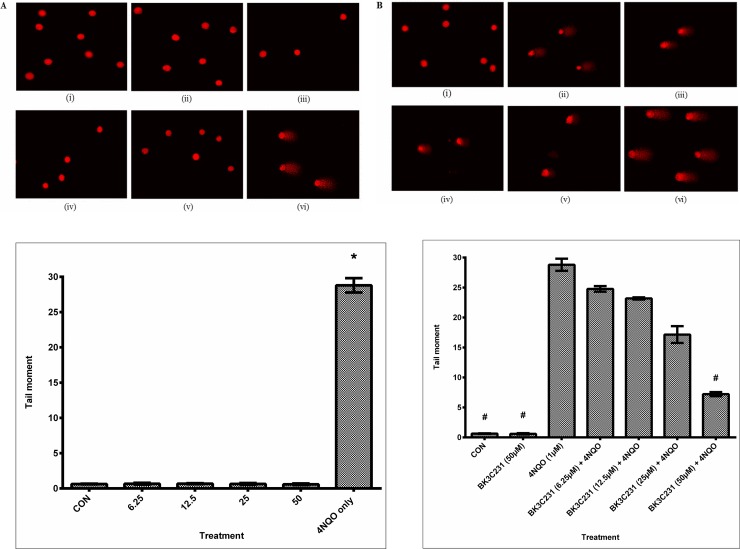
Fig 3. DNA microlesion assessment in CCD-18Co cells using alkaline comet assay.
(A) Fluorescence microscopic images with EtBr staining of untreated cells (i), cells treated with BK3C231 at 6.25 μM (ii), 12.5 μM (iii), 25 μM (iv) and 50 μM (v) for 24h and cells treated with 4NQO at 1 μM for 1h (vi). (B) Fluorescence microscopic images of untreated cells (i), cells treated with BK3C231 at 6.25 μM (ii), 12.5 μM (iii), 25 μM (iv) and 50 μM (v) for 2h prior to 4NQO induction at 1 μM for 1h and cells treated with 4NQO at 1 μM for 1h (vi). (C) Screening for DNA damage expressed as tail moment in cells treated respectively with BK3C231 from 6.25 μM till 50 μM for 24h and 4NQO at 1 μM for 1h. (D) Cells were pretreated with BK3C231 from 6.25 μM till 50 μM for 2h prior to 4NQO induction at 1 μM for 1h. Each data was obtained from three independent experimental replicates and each data point in (C) and (D) was expressed as mean ± SEM of tail moment. * p<0.05 against negative control, CON (C) and # p<0.05 against positive control, 4NQO only (D).

