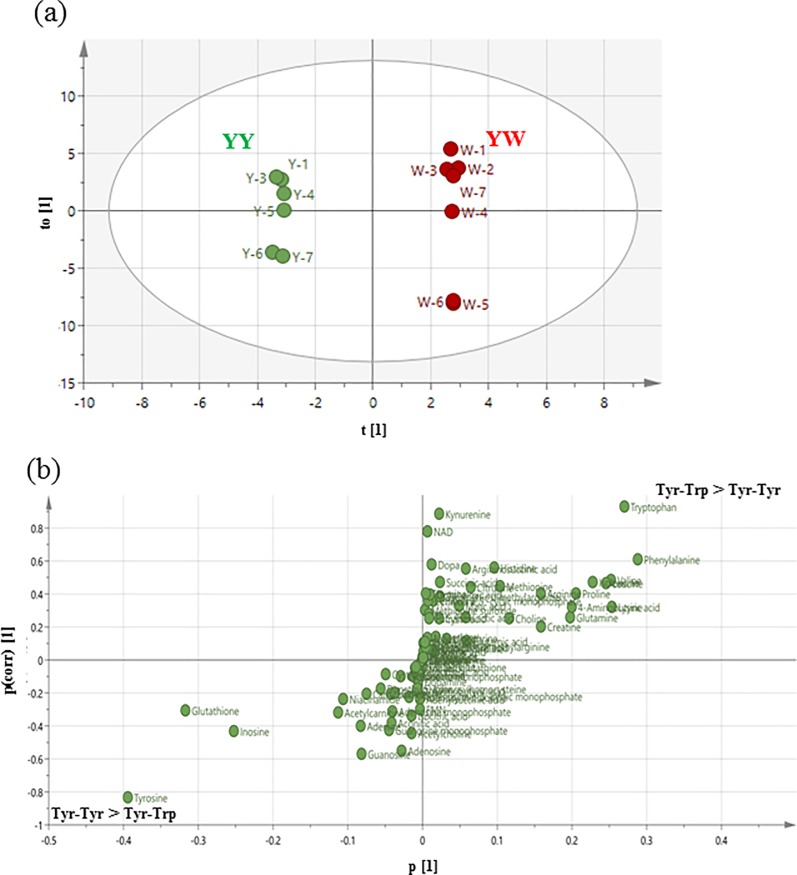
Fig 4. Metabolome analysis of Tyr-Trp vs. Tyr-Tyr.
(a) Score plot of orthogonal projections to latent structure discriminant analysis and (b) loading S-plot of orthogonal projections to latent structure discriminant analysis derived from liquid chromatography–mass spectrometry/mass spectrometry data sets (Tyr-Trp vs. Tyr-Tyr).

