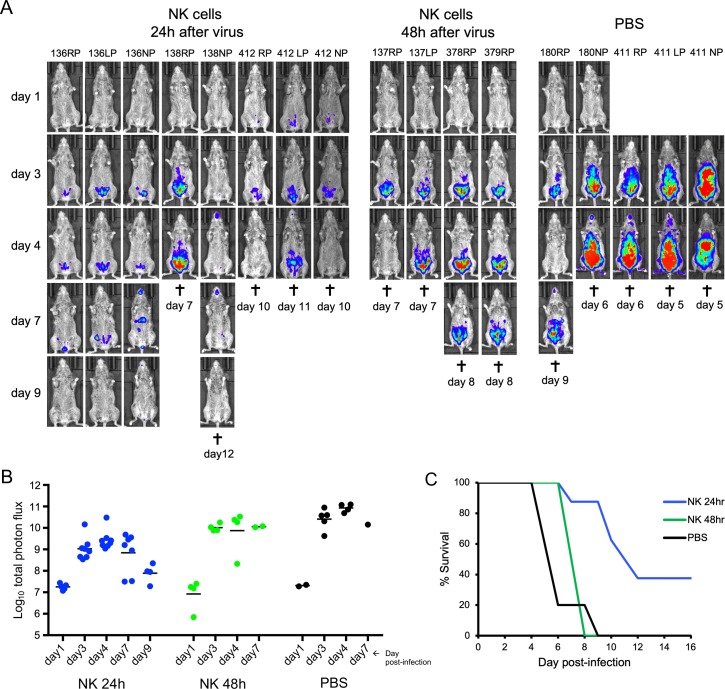
Fig 8. Passive transfer of activated NK cells following VACV infection.
(A) Data are compiled from two separate experiments. In the first experiment, CAST mice were infected IP with 655 PFU of VACV expressing FLuc. After 24 or 48 h, 4 to 5 mice were inoculated IP with 3.1x10⁶ activated NK cells. Two mice received PBS instead of NK cells as a control. In the second experiment, CAST mice were infected with 550 PFU of VACV and after 24 h, 3 mice (412RP, 412LP, and 412NP) were inoculated with 3.0 X 10⁶ activated NK cells and 3 mice (411RP, 411LP and 411NP) received PBS. Virus spread was determined by luminescence as in Fig 2. Ventral images of individual mice are shown. (B) The total photon flux for individual animals are shown. The difference between the 8 mice receiving NK cells at 24 h after infection versus the 5 PBS controls was significant on days 3 and 4 after infection (p = 0.0031 and 0.004, respectively). (C) Days of death or euthanasia (†) and survival curves for the two experiments are shown. The time to death between the mice receiving NK cells at 24 h after infection and PBS controls was significant (p = 0.022, determined by Mantel-Cox test).

