Fig. 4.
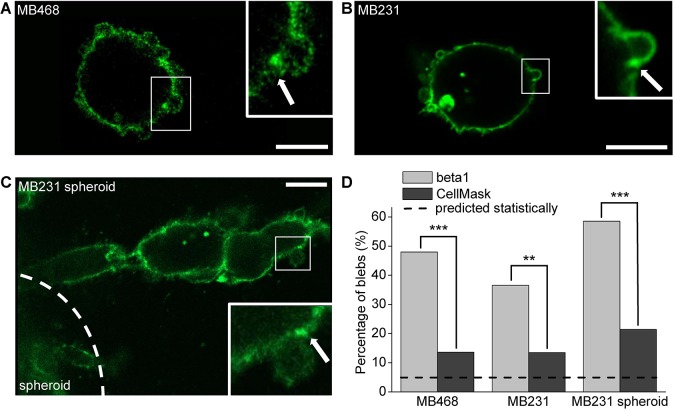
β1 integrins cluster at bleb necks. (A-C) Representative images of a 1 mg/ml collagen I-embedded MDA-MB-468 cell (A), MDA-MB-231 cell (B) and the edge of an invading MDA-MB-231 spheroid labeled with a β1 integrin antibody (C). Corresponding images of the general membrane marker CellMask are shown in Fig. S5a-c for each of the three images. In the insets, arrows mark a position at the bleb neck showing an integrin cluster. Scale bars: 10 µm. (D) Analysis of fluorescence intensity distribution of β1 integrin receptors and CellMask at bleb necks. Fluorescence values at the bleb neck exceeding the mean+2s.d. fluorescence of the entire cell were considered clusters. Graph shows the occurrence of blebs (%) with one or two β1 integrin or CellMask clusters at the bleb necks. n=125 blebs for MDA-MB-468, n=104 for dispersed MDA-MB-231 and n=140 for MDA-MB-231 spheroids. Data was pooled from three statistically equivalent independent experiments. The occurrence of β1 integrin and CellMask clusters at bleb necks were compared both with each other and with the expected occurrence using a t-test between percentages. Dashed line indicates the expected incidence of bleb clusters assuming a normal distribution of data. All images and quantified data are from cells imaged 6 h after embedding in the matrix. **P<0.01, ***P<0.001.

