Fig. 1.
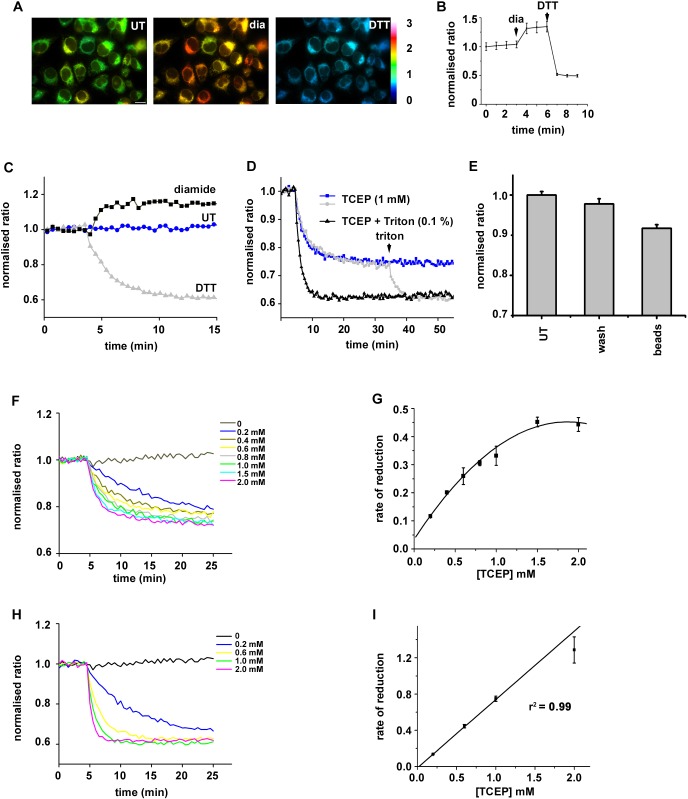
Reduction of ER-localised disulfides by TCEP requires a membrane component. A stable cell-line expressing ER-SFGFP-iE was evaluated by live-cell imaging and was responsive to gross changes in redox conditions. (A) Fluorescent images of untreated, diamide- (1 mM) or DTT-treated (10 mM) cells. Fluorescence ratio changes are visualised using false colours, with a more reducing ratio in blue and a more oxidising in yellow. (B) Normalised fluorescent ratios of individual cells (n=37) are averaged (mean±s.d.) and changes observed over time by the sequential addition of diamide (1 mM) and DTT (10 mM). (C) Normalised fluorescence ratio changes in microsomal membranes isolated from the cell line expressing ER-SFGFP-iE, followed using a plate reader. An increase in ratio is seen following diamide (1 mM) addition whereas a decrease is seen following DTT (1 mM) addition. The ER-SFGFP-iE in untreated cells is, therefore, neither fully oxidised nor reduced. The experiment was repeated four times (n=5). (D) Changes in normalised fluorescence ratio following the addition of impermeable TCEP in the absence (blue) or presence (black) of Triton X-100. After 35 min, Triton X-100 (0.1% v/v) was added to solubilise the intact microsomes. Note the slower rate of reduction and the lack of full reduction with TCEP unless the membranes are solubilised. The experiment was repeated twice (n=3). (E) ER-SFGFP-iE is reduced by TCEP immobilised on agarose beads, further confirming that the reduction is not direct. The experiment was carried out in triplicate with average (mean±s.d.) indicated for untreated (UT), buffer preincubated with TCEP beads (wash) and TCEP beads (beads). (F-I) The change in normalised fluorescent ratio was followed at various TCEP concentrations as indicated either without (F) or with (H) detergent solubilisation of microsomes. The rate of reduction at each TECP concentration was calculated in triplicate with the average (mean±s.d.) plotted versus the TCEP concentration (G,I).

