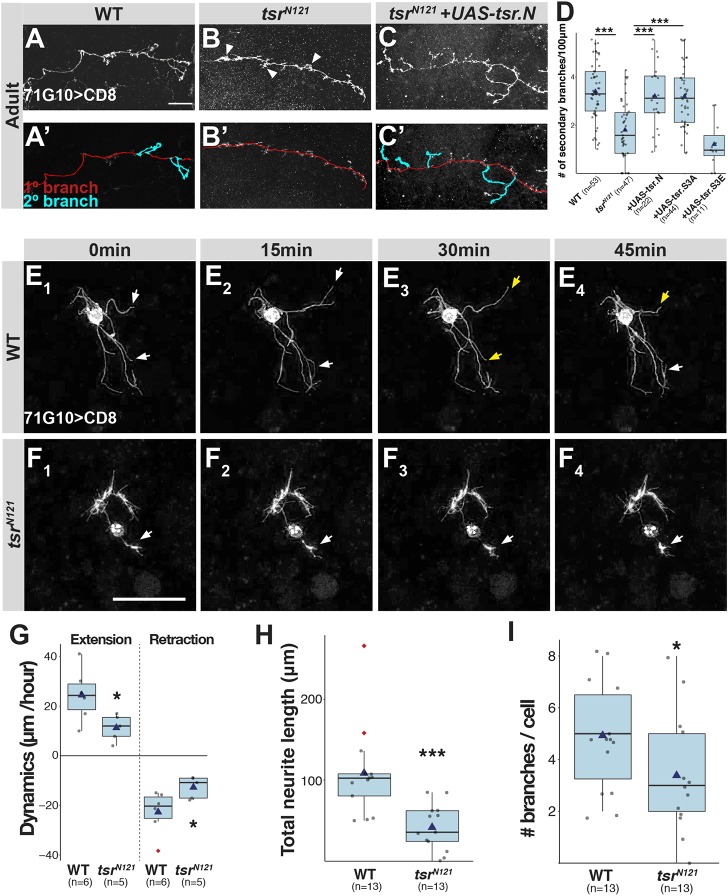
Fig. 2.
Tsr is required for γ-neuron branch dynamics. (A–C) Confocal Z-projections of WT (A), tsrN121 (B) or tsrN121 additionally expressing UAS-tsr.N (C) γ-neuron MARCM SCCs. A′–C′ are tracings of the primary axon in red, with secondary branches in cyan. Arrowheads point to axonal structures that appear to be failed branch points. Gray is R71G10-Gal4-driven mCD8::GFP. (D) Box-plot quantification of secondary branches (>5 µm) per 100 µm of primary axon. (E,F) Time-lapse series (15 min increments) of confocal Z-projections of WT (E) or tsrN121 (F) primary γ-neurons derived from L3 brains. White and yellow arrows point to extending or retracting branches, respectively. Gray is R71G10-Gal4-driven mCD8::GFP. (G) Box-plot quantification of cell dynamics expressed as change in neurite length divided into extensions and retractions per 1 h imaging averaged over 3 h. (H) Box-plot quantifications of total neurite length per cell. (I) Box-plot quantification of number of branches per cell. Scale bars: 20 µm. *P<0.05; ***P<0.005.

