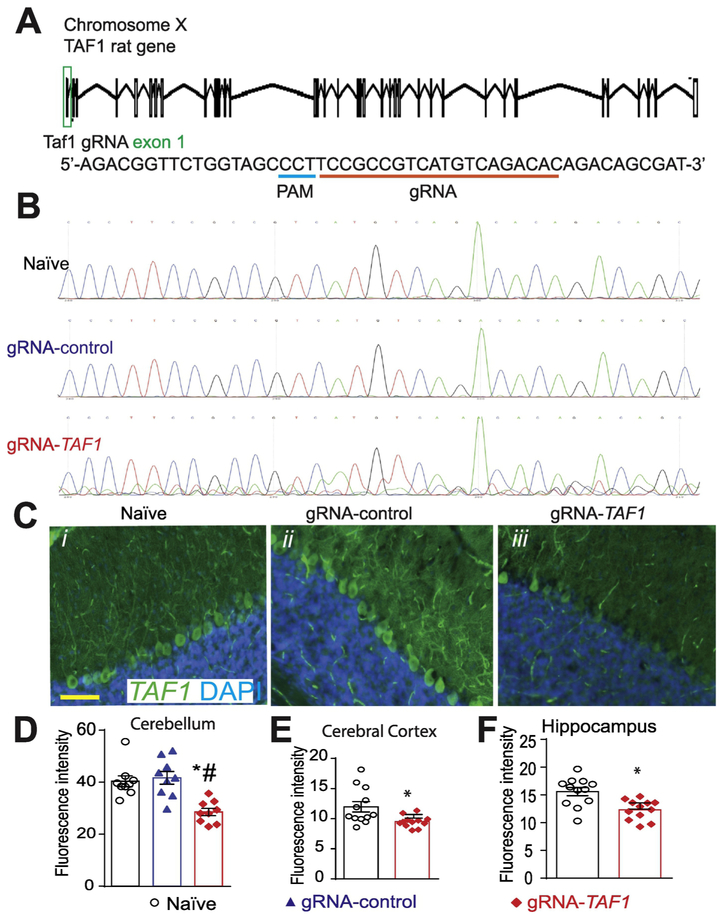
Figure 1. Scheme of guide RNA and PAM sequence targeting exon 1 in the rat TAF1 gene.
(A) Schematic showing exon/intron organization of the TAF1 gene in rat. To disrupt TAF1, we designed a gRNA targeting exon 1. We used a guide RNA (gRNA) targeting a non-coding region in exon 1 of the TAF1 gene. Both gRNAs are based on the reverse strand sequence and are indicated on the figure by the red line oriented from 5’ to 3’. The protospacer adjacent motif (PAM sequence) is indicated by a blue line. The gRNA pairs with its DNA target followed by a 5’NGG sequence (PAM sequence). Cas9 catalyzes a double-stranded cleavage on the genomic DNA 3 bp before the PAM sequence. Nucleotide positions are indicated based on the DNA sequence on the TAF1 gene. (B) Representative sequences (around the PAM sequence) of Exon 1 within the TAF1 gene in naïve, gRNA-control, and gRNA-TAF1 edited animals. Note the indel mutation(s) in the sequence of DNA isolated from the TAF1 edited animals. These experiments were performed with three different animals per each experimental condition. (C) Representative immunohistochemistry images of cerebellar Purkinje cells stained with an antibody against TAF1. Reduced TAF1 expression was observed in the TAF1-edited rat pups compared to control editing or naïve group of rat pups. Quantification of fluorescence intensity for the TAF1 immunohistochemistry in the (D) cerebellum, (E) cerebral cortex and (F) hippocampus. These experiments were performed with 4 male animals per each experimental condition in an investigator blinded manner. Scale bar = 200 μm. Data are shown as mean ± S.E.M. from 3 different fields from 4 animals per experimental condition (i.e. a total of twelve fields per group). *p<0.05 versus; naïve, #p<0.05 versus gRNA-control (ANOVA followed by Tukey’s test).

