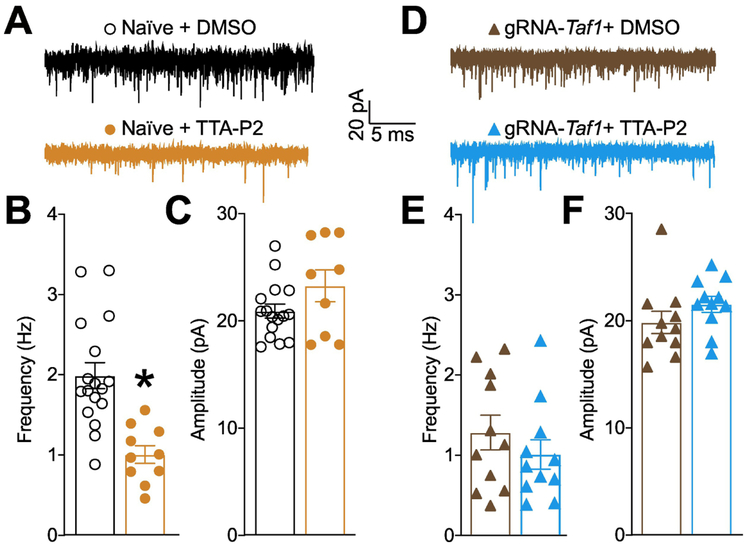
Figure 10. T-type calcium channels control cerebellar sEPSC frequency and are inhibited after Taf1 editing.
(A) Representative recording traces of cells from naïve rats treated with 1μM TTA-P2 or 0.1% DMSO (vehicle). Bar graph with scatter plot showing the (B) frequency and (C) amplitude of sEPSCs for the indicated groups. Data are shown as mean ± S.E.M., n = 10-16 Purkinje cells from at least 3-4 animals per experimental condition. *p<0.05 versus; vehicle (Student’s t test). (D) Representative recording traces of cells from Taf1 edited rats treated with 1μM TTA-P2 or 0.1% DMSO (vehicle). Bar graph with scatter plot showing the (E) frequency and (F) amplitude of sEPSCs for the indicated groups. Data are shown as mean ± S.E.M., n = 11 Purkinje cells from at least 3-4 animals per experimental condition. *p<0.05 versus; vehicle (Mann-Whitney). The experiments were conducted in an investigator blinded manner.

