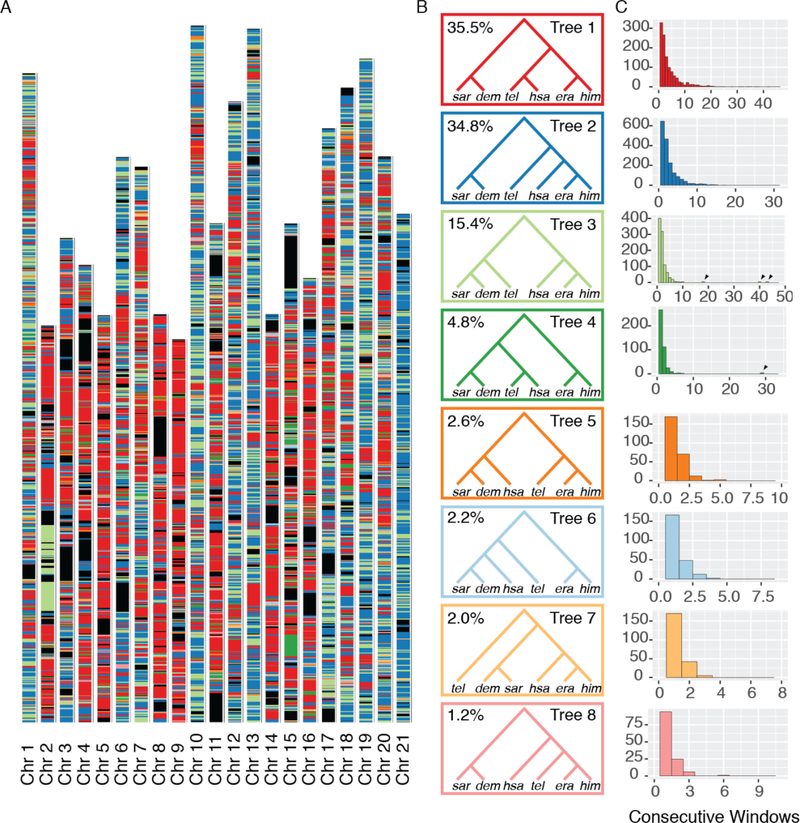
Fig. 2: Local evolutionary history in the erato-sara clade is heterogeneous across the genome.
A. Each bar represents a chromosome, in terms of the H. erato reference (14). Colored bands represent tree topologies of each 50 kb window; colors correspond to the topologies in B, with black regions showing missing data. B. The eight most common trees are shown. The value in the top left corner is the percentage of all 50 kb windows that recover that topology. C. Each histogram corresponds to the topology of the same color in B, and shows the distribution of the number of consecutive 50 kb windows with that topology. Arrows indicate long blocks in inversions.

