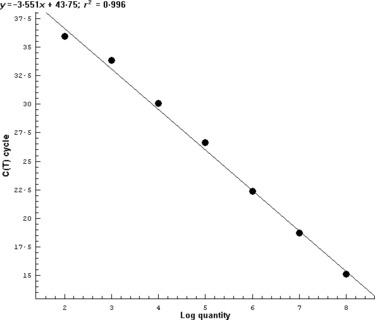
Figure 3.

Standard curve created by the analysis of known copies of target nucleic acid. Reactions with copy numbers of target gene from 102 to 108 were used for creating the standard curve. The standard curve was plotted by the log concentration of copy numbers against C t values.
