Figure 1.

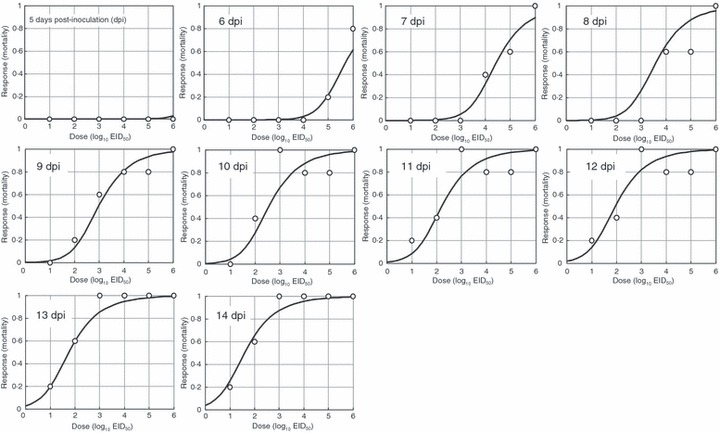
The best‐fit model (beta‐Poisson model with exponential‐inverse‐power DPI dependency) (curves) compared to observed mortalities against doses (symbols) from the study of Fan et al. (2009) (data set no.1).

The best‐fit model (beta‐Poisson model with exponential‐inverse‐power DPI dependency) (curves) compared to observed mortalities against doses (symbols) from the study of Fan et al. (2009) (data set no.1).