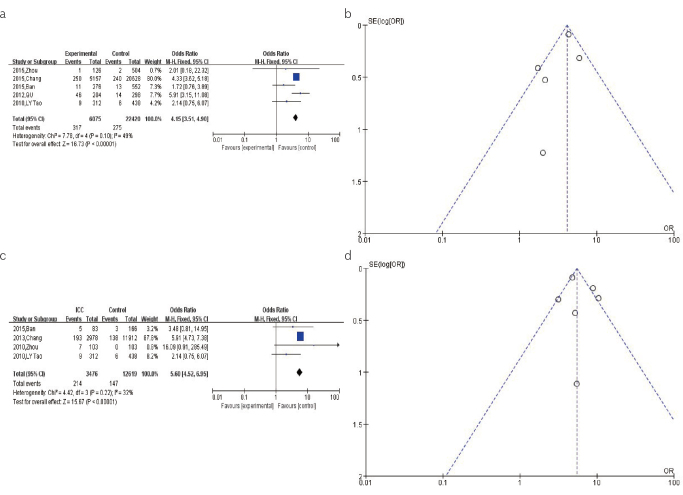
Figure 4. a–d.
(a). The forest plots depicting the pooled analysis of the association between the HCV infection and CCA risk. (b). The funnel plots showing the evaluation of the publication bias of the association between HCV infection and CCA risk. (c). The forest plots depicting the pooled analysis of the association between the HCV infection and ICC risk. (d). The funnel plots showing the evaluation of the publication bias of the association between the HCV infection and ICC risk.

