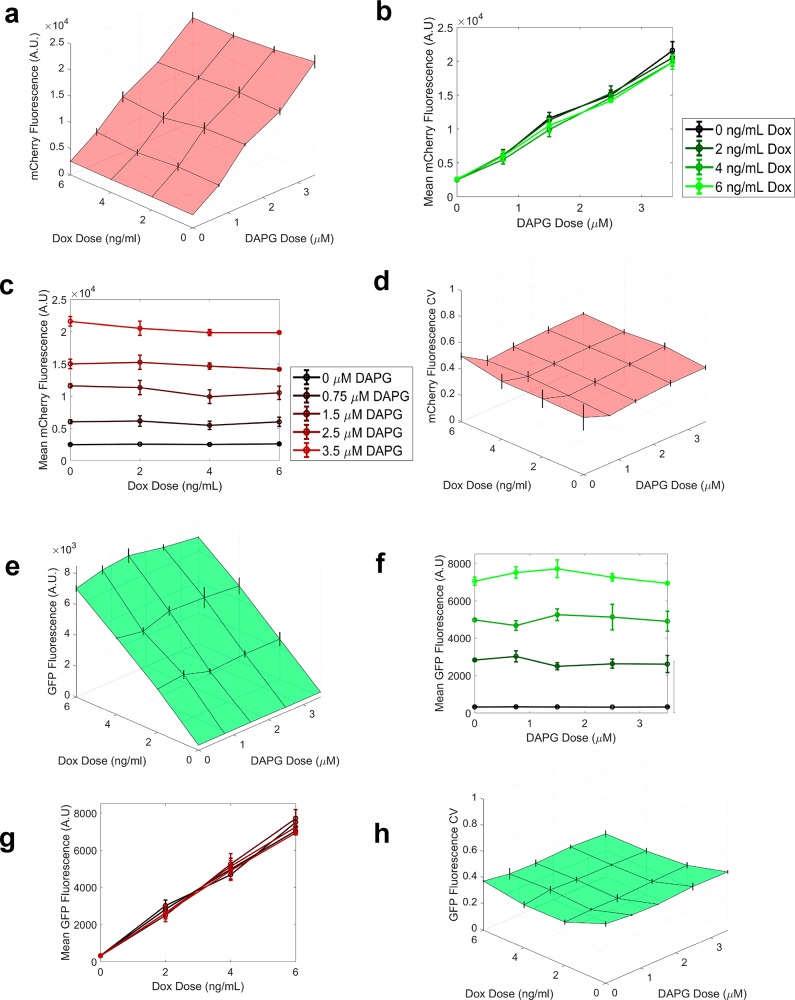
Figure 4.
Assessing experimental orthogonality of multiplexed linearizer circuits. (a) Bivariate dose response of mean mCherry fluorescence intensity in HEK 293 Flp-In cells harboring both stably integrated phlF-mLin and TetR-mLin gene circuits within the same clonal cell line versus pairwise DAPG and Dox inducer concentrations. Error bars represent standard deviation calculated from 3 independent replicates per inducer dose-pair. (b) 2-Dimensional slices through the mCherry fluorescence plane showing mean fluorescence across DAPG inducer concentrations for different Dox concentrations (red colors). (c) 2-Dimensional slices through the mCherry fluorescence plane showing mean fluorescence across Dox inducer concentrations for different Dox concentrations (green colors). No significant differences were found in mCherry fluorescence between groups of Dox concentrations (ANOVA, p > 0.05) (d) Bivariate dose–response of average mCherry CV across pairwise DAPG and Dox induction doses. (e) Bivariate dose–response (plane) of mean eGFP fluorescence expression averaged from 3 replicates across pairwise DAPG and Doxycycline inducer concentrations. Error bars represent standard deviation calculated from 3 independent replicates per dose-pair. (f) 2-Dimensional slices through the eGFP fluorescence plane showing mean fluorescence across DAPG inducer concentrations for different Dox concentrations (red colors). No significant differences were found in eGFP fluorescence between groups of DAPG concentrations (ANOVA, p >.05). (g) 2-Dimensional slices through the eGFP fluorescence plane showing mean fluorescence across Dox inducer concentrations for different Dox concentrations (green colors). (h) Bivariate dose–response of average eGFP CV across pairwise DAPG and Dox inducer concentrations.

