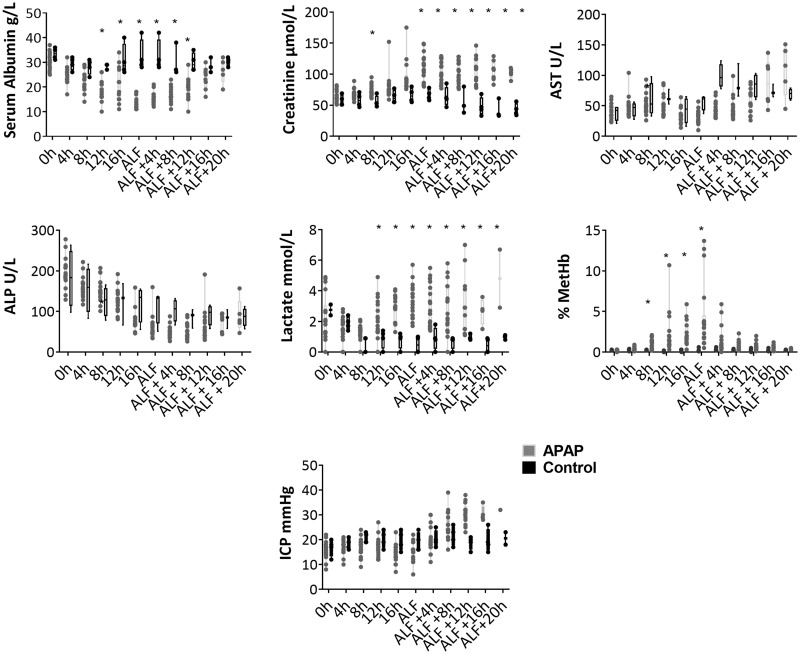
Figure 1.
Parameters measured to characterize the ALF model. Each is plotted at 4-h intervals up to ALF, and thereafter at 4-h intervals to postmortem. The figure shows, from left to right, upper row; albumin, creatinine, and AST. Middle row; ALP, blood lactate, and blood % metHb and bottom row; ICP measured via anesthetic monitoring. Boxes display median and interquartile range and the whiskers show the full range. Asterisk (*) indicates where APAP-treated animals were significantly different from controls with a q value <.05 after FDR correction, following Kruskal-Wallis with multiple comparisons.

