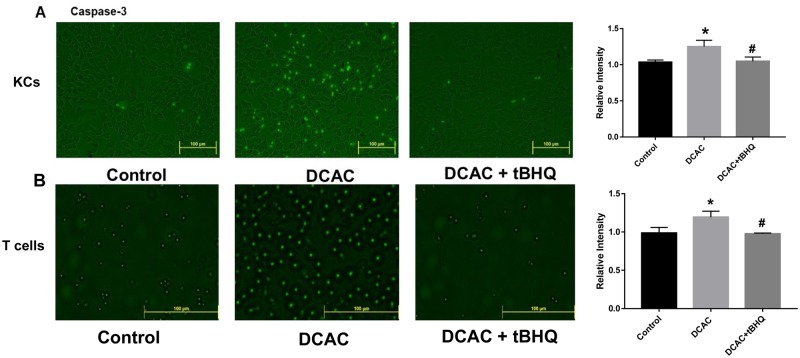
Figure 1.
Treatment of KCs and T cells with tBHQ attenuated DCAC-induced caspase-3 expression. KCs and T cells were pretreated with/without tBHQ (5 µm) 1 h prior to incubation with DCAC (5 mM) for 24 h. A, Fluorescent images of caspase-3 in KCs. B, Fluorescent images of caspase-3 in T cells. Bar diagrams on the right sides represent quantification of fluorescent intensity of caspase-3 in KCs and T cells; n = 3 in each group. *p < .05 (Control vs DCAC); #p < .05 (DCAC vs DCAC+ tBHQ).

