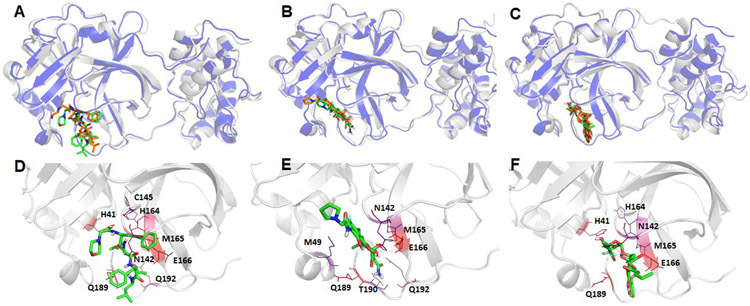
Figure 6.
Structural comparison between the crystal structure and a representative MD structure of SARS-Cov-2 main protease bound to three neutral ligands DB08889, DB12329, and DB00385. The crystal structure is shown as blue cartoon with the docked ligand shown as brown sticks, while the representative MD structure is shown in grey cartoon and the ligand as green sticks. A: DB08889, B: DB12329, and C: DB00385. The detailed ligand-receptor interactions are shown in the bottom panel (D-F). All the hotspot residues (ΔGLig-Res < −3.0) revealed by MM-GBSA analyses are labeled and colored by a blue to red spectrum, the more bluish a residue is colored, the stronger the interaction between the residue and the ligand. D: DB08889, E: DB12329, and F: DB00385.

