
Figure 2.
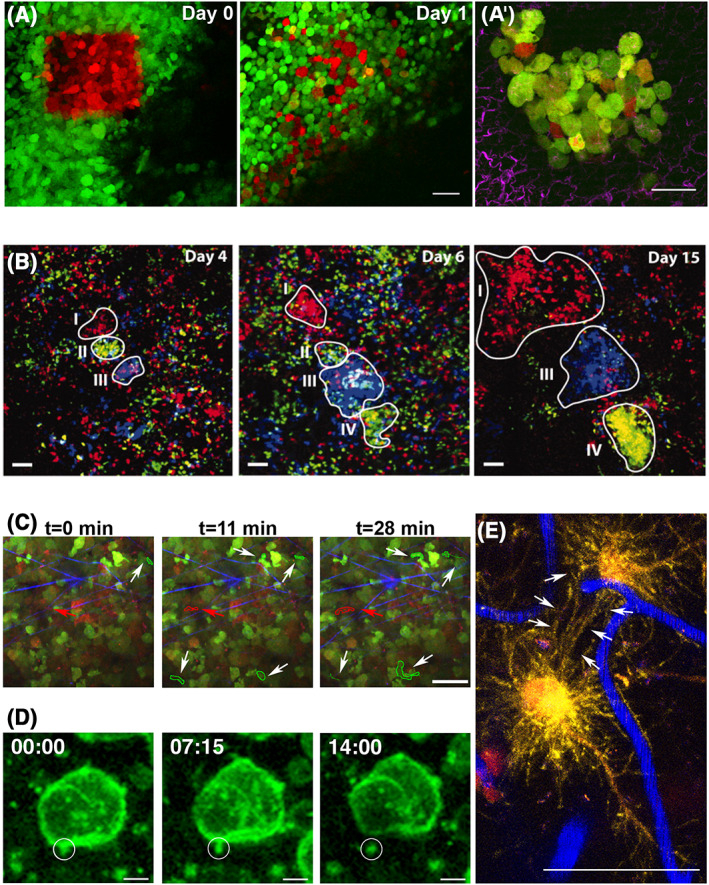
High‐resolution intravital multiphoton microscopy (IV‐MPM) and new fluorescent proteins allow cell fate mapping and studying cell‐cell communication mechanisms in cancer. Photoswitchable fluorescent proteins allow tracking of individual cells in vivo. (A) Longitudinal IV‐MPM imaging of photoswitched Dendra2 (green to red) expressed by mammary tumor cells shows cell dispersion adjacent to a blood vessel (dark region) after 1 day. Scale bar, 30 μm. Adapted and reprinted with permission from.56 (A') A lung metastatic colony is observed ex vivo, 5 days post‐photoconversion of Dendra2 expressed by mammary tumor cells in the primary tumor. Red cells arrived in the lung at 0 to 5 days, orange or yellow cells divided and synthesized additional green Dendra2. Green cells cannot be traced. SHG signal from collagen fibers is shown in magenta. Scale bar, 50 μm. Adapted and reprinted with permission from Gligorijevic et al.18 (B) In vivo lineage tracing. Series of IV‐MPM images of a growing carcinoma at the indicated time points after induction of the confetti constructs (blue: CFP+ cells, green: YFP+ cells, red: RFP+ cells). Different growth patterns of clones were observed (outlined and indicated by I‐IV). Region I displays continuous growth, regions II and III show growth before disappearance or regression, respectively, and region IV shows a delayed onset of clonal outgrowth. Scale bars, 50 μm. Adapted and reprinted with permission from Zomer et al.57 (C) Motility analysis of hypoxic cells in vivo. IV‐MPM images of a xenograft mammary tumor at 0, 11, and 28 min. Tumor cells were engineered to switch from expressing a green fluorophore to a red fluorophore in hypoxic conditions. White arrows point to motile normoxic cells (green outline). Red arrow points to a motile hypoxic cell (red outline). SHG signal from collagen fibers is shown in blue. Scale bar, 50 μm. Adapted and reprinted with permission from Wang et al.58 (D) Following extracellular vesicles (EVs) in vivo. IV‐MPM time‐lapse recordings show a tethered vesicle (circle) released in the extracellular compartment. Tumor cells were labeled with membrane GFP (green). Time is shown in min:sec. Scale bars, 5 μm. Adapted and reprinted with permission from Lai et al.59 (E) Brain cancer cells communicate via tumor microtubes. IV‐MPM of glioblastoma cells (red) in the mouse brain reveals tumor microtubes, rich in actin (yellow) that interconnect single tumor cells (arrows). Blood vessels are shown in blue. Scale bar, 50 μm. Adapted and reprinted with permission from Osswald et al.60 [Correction added on 12 July 2019, after first online publication: the Figure 2 caption has been updated.]