Figure 3.

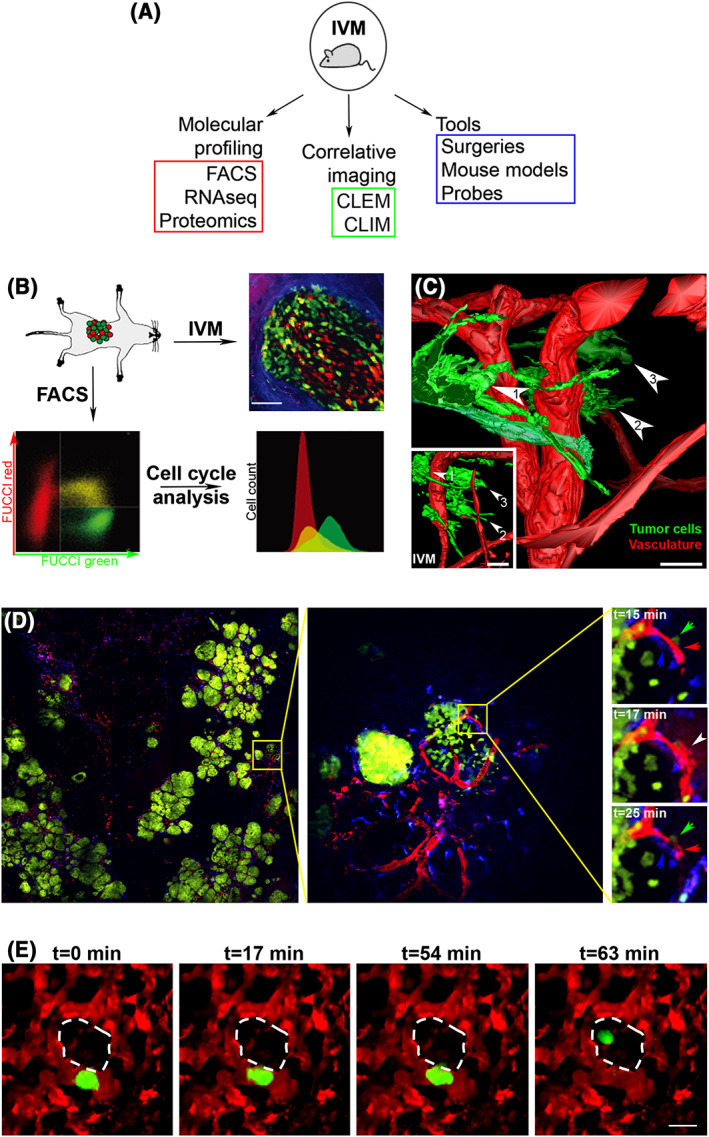
Extending the capabilities of intravital multiphoton microscopy (IV‐MPM) with correlative imaging, molecular profiling, and other emerging tools. (A) Methods that extend the potential of IV‐MPM. IV‐MPM: intravital multiphoton microscopy; FACS: fluorescence‐activated cell sorting; RNAseq: RNA sequencing; CLEM: correlative light and electron microscopy; CLIM: cryosection labeling and intravital microscopy. (B) Molecular profiling of cells imaged in vivo using fluorescence‐activated cell sorting (FACS). Fluorescent ubiquitination‐based cell cycle indicator (FUCCI)‐expressing invasive colon cancer cells were inoculated into the cecum of mice (top left panel) and observed by IV‐MPM (top right panel). Tumor dissociation and fluorescence‐activated cell sorting (FACS) enables analysis of the cell cycle profiles (bottom panels). Green: FUCCI‐green, S/G2; red: FUCCI‐red, G1; blue: SHG signal from collagen fibers. Scale bar, 75 μm. Adapted and reprinted with permission from Kagawa et al.100 (C) Intravital correlative light and electron microscopy (CLEM). Three‐dimensional (3D) model obtained from serial transmission electron microscopy imaging of a subcutaneous xenograft in the mouse ear. Three tumor cells (green) from the invasive front imaged with IV‐MPM have been retrieved and highlighted (numbered arrowheads). The inset shows a 3D model from the IV‐MPM dataset. Blood vessels are shown in red. Scale bars, 20 μm. Adapted and reprinted with permission from Karreman et al.101 (D) Large‐volume high‐resolution intravital imaging (LVHR‐IVI). Left panel: a single z plane showing large area imaging of a mammary tumor within a transgenic mouse expressing fluorescent proteins. Green: Dendra2‐expressing tumor cells, red: fluorescent dextran labeled vasculature, blue: CFP expressing macrophages. Scale, 4 × 4 mm. Middle panel: one individual tile (yellow square) from which the mosaic is composed. Image shows two groups of cancer cells with distinct growth patterns. Scale, 512 × 512 μm. Right panels: time lapse imaging of the subregion (yellow square). A macrophage (blue arrow), a tumor cell (green arrow), and an endothelial cell (red arrow) induce transient vascular leakage (white arrow). Scale, 133 × 133 μm. Adapted and reprinted with permission from Entenberg et al.102 (E) Lung IV‐MPM. Stills from a time‐lapse IV‐MPM imaging video of a spontaneously metastasizing tumor cell (green) in the lung vasculature (red), 1 day after window implantation. The cell crosses the endothelium into the alveolar space (dashed white outline) by t = 63 min. Scale bar, 15 μm. Adapted and reprinted with permission from Entenberg et al.103
