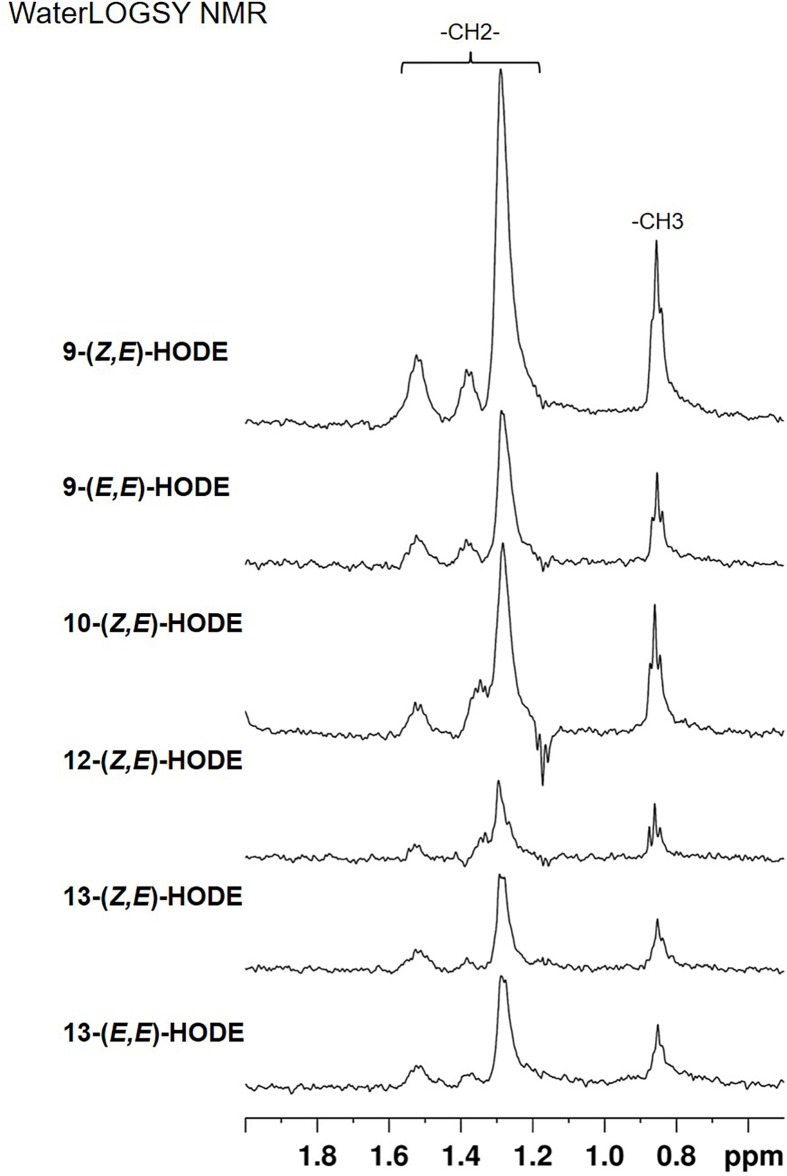
Figure 3. WaterLOGSY spectra of HODE isomers in the methyl/methylene region.
Shown are the difference spectra wherein those in the absence of PPARγ LBD were subtracted from those in the presence of the protein (see Supplementary Figure S2). From top to bottom, spectra for 9-(Z,E)-HODE, 9-(E,E)-HODE, 10-(Z,E)-HODE, 12-(Z,E)-HODE, 13-(Z,E)-HODE, and 13-(E,E)-HODE are presented.

