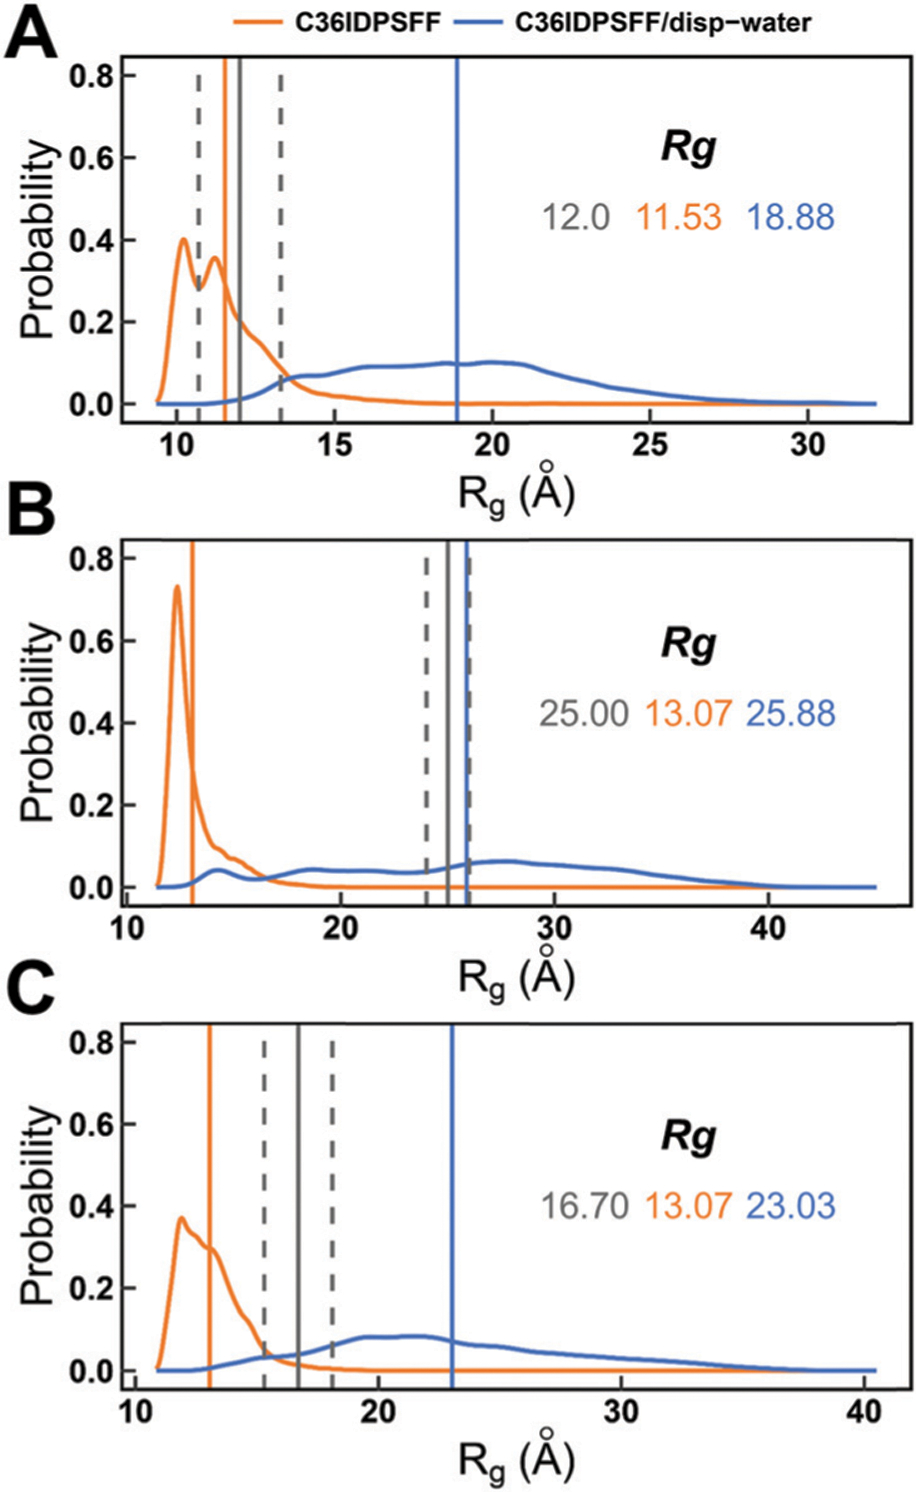
Fig. 9.

Probability distributions of the radii of gyration for disordered proteins simulated with mTIP3P and disp-water water models. (A) Aβ40. (B) ACTR. (C) drkN SH3. The averaged Rg values of simulations with mTIP3P and disp-water are marked by vertical solid lines in orange and blue, respectively. The experimental values are marked by vertical solid lines in gray and the errors are marked by two vertical dash lines in gray. The simulated and experimental Rg values are also labeled with the corresponding colors.
