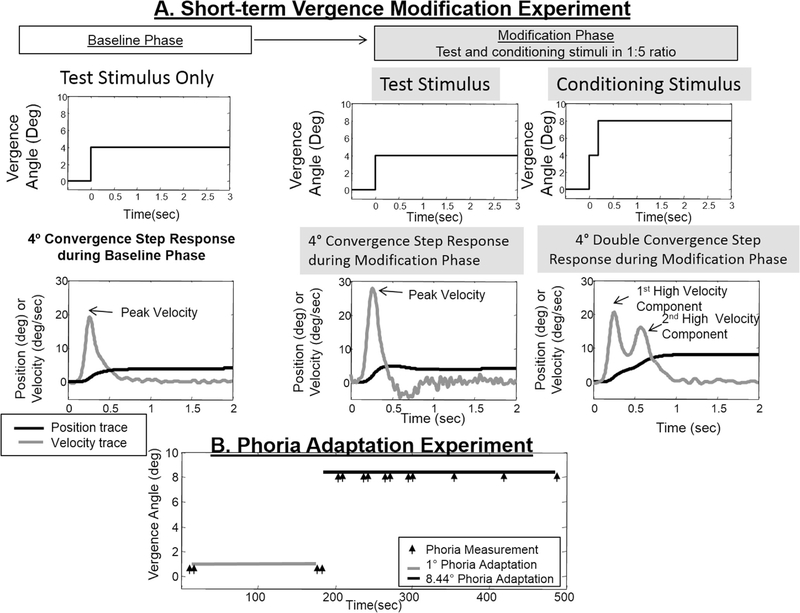
Fig. 2.
A: An example of 4° single convergence step position (black) and velocity (gray) traces recorded during the baseline phase (left column) and modification (middle column) phase. Double steps have two high-velocity components termed the first high-velocity component and second high-velocity component (right column). The arrows in plot A indicate the peak velocity. During the conditioning phase, the peak velocity of the 4° vergence steps is greater compared to the baseline responses as a result of the short-term modification experiment. 2B: The phoria adaptation experimental protocol where each arrow represents a phoria measurement.

