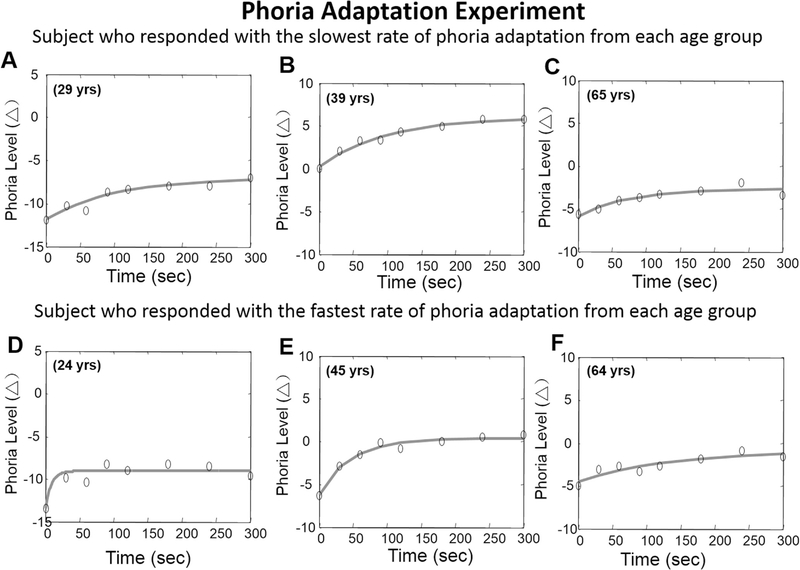
Fig. 6.
Examples of phoria measurements (denoted as ‘o’) from six subjects where the first row are subjects who exhibited the slowest rate of phoria adaptation to the 40 cm (8.44°) binocular target for each age group. The second row are subjects who exhibited the fastest rate of phoria adaptation. The first, second and third column are from subjects within the young, mid-aged and older age groups, respectively. The age of the subject is denoted in the upper left portion of each plot. The phoria measurements were fit with an exponential curve denoted using a solid black line.

