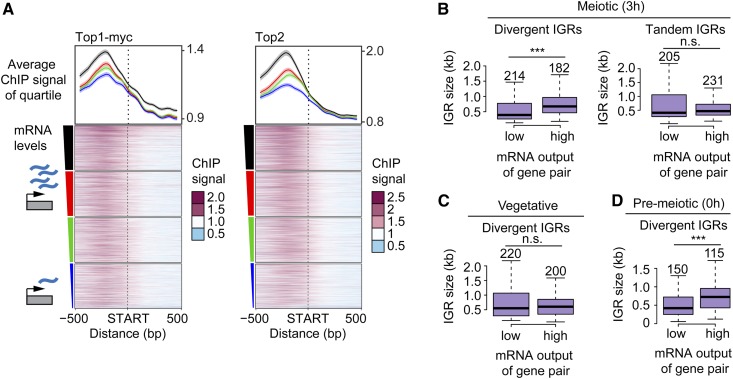
Figure 2.
Topoisomerase enrichment correlates with mRNA levels. (A) Top1 and Top2 localization 500 bp up- and downstream of starts of ORFs, sorted based on the amount of steady-state mRNA of the associated gene. The average of each quartile is plotted above the heat maps. The colors of the lines correspond to the color segments beside the four quartiles of transcriptional activity. The 95% confidence interval for the average quartile lines is shown. (B) Box plots showing the size distribution of divergent and tandem IGRs during meiosis for gene pairs with either extremely high or low levels of associated mRNA. The size of each group was chosen to achieve similar numbers of gene pairs, which are noted above the respective box, and vary due to the changes in the transcriptional program as well as the data set used. Significance was determined by unpaired, two-sided Wilcoxon test. (C and D) Similar analysis as in B, for divergent IGRs in (C) vegetative and (D) premeiotic cells using data from (Cheng et al. 2018). Note that gene pair identity changes as a function of the transcriptional program in the different developmental stages. *** P < 0.001 and n.s. P = 0.71 (B) and P = 0.54 (C), Mann–Whitney–Wilcoxon test.

