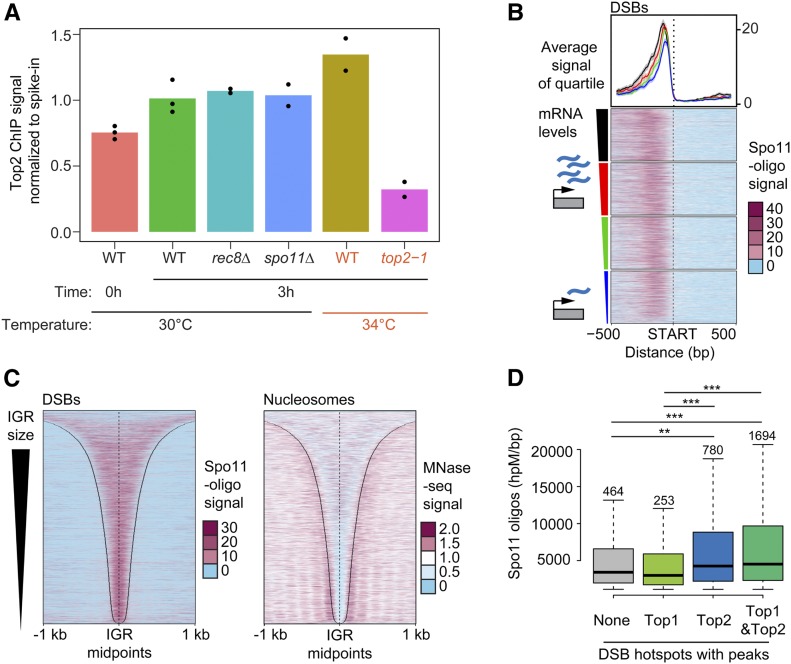
Figure 3.
Sites of topoisomerase enrichment partially overlap with DSB hotspots. (A) Comparison of the level of total chromosomal association of Top2 on premeiotic (0 hr) and meiotic chromosomes (3 hr after meiotic induction) as determined by SNP-ChIP spike-in analysis. Top2 levels were determined for meiotic chromosomes for various mutant backgrounds (rec8Δ and spo11Δ) as well as at 34° (wild type and top2-1). Points represent individual replicate values and bars represent average. Values for each experimental replicate are normalized to the average wild-type meiotic (3 hr) levels. (B) Heat maps of Spo11-oligo signal 500 bp up- and downstream of starts of ORFs, sorted based on the amount of steady-state mRNA of the associated gene. Colored triangle segments indicate four quartiles of transcriptional activity. The average and 95% confidence interval of each quartile is plotted above the heat maps. Heat maps of (C) Spo11-oligo signal and nucleosome signal determined by MNase-seq across all promoter regions sorted by IGR size. Black lines delineate IGR borders. (D) Comparison of hotspot activity based on whether hotspots overlap with a significant peak of either no topoisomerase, Top1, Top2, or both Top1 and Top2. Significant peaks were determined by MACS (see Materials and Methods). Number of hotspots in each group is labeled above the respective box in the plot. *** P < 0.0001, ** P < 0.01, Mann–Whitney–Wilcoxon test with Bonferroni correction.

