Figure 4.
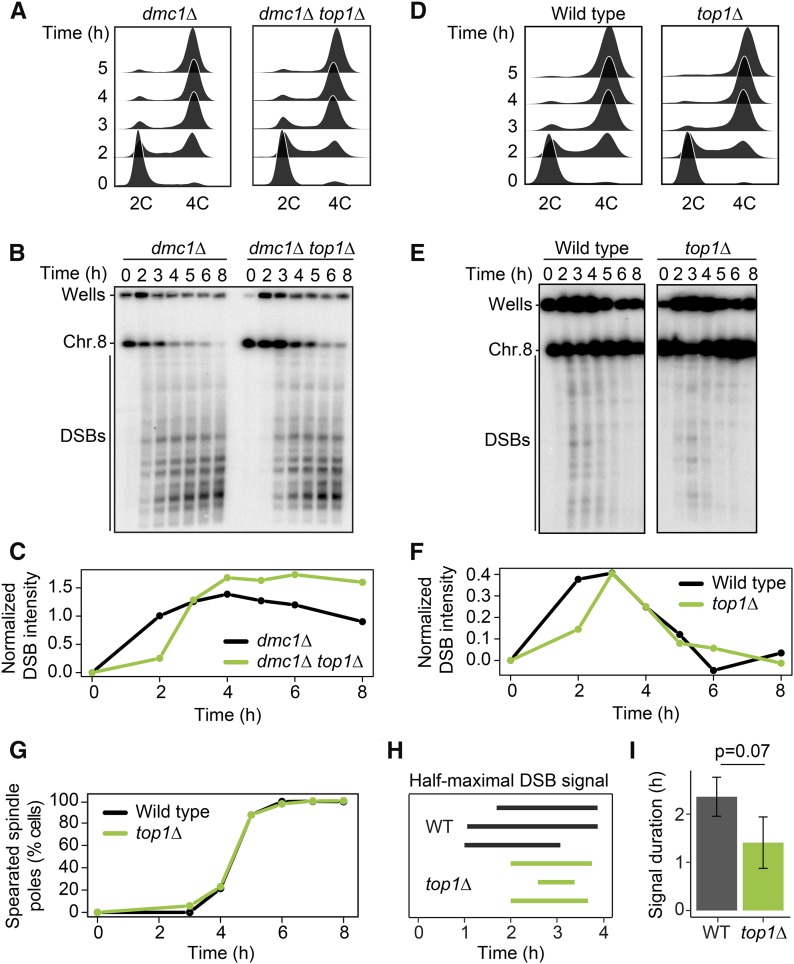
Loss of TOP1 shortens the interval of DSB activity. (A) DNA content of dmc1Δ and dmc1Δ top1Δ cells as determined by flow cytometry. Samples were taken at the indicated time points. (B) Pulsed-field gel electrophoresis /Southern analysis of DSBs along chromosome VIII in dmc1Δ and dmc1Δ top1Δ cells. Results were consistent across three experiments. (C) Quantification of DSB signal in B, calculated as fraction of total signal (parental and DSB) after background subtraction. (D–F) Time course analysis of wild-type and top1Δ cells. The analyses are the same as in A–C (n = 3). (G) Spindle-pole separation as measured by anti-tubulin immunofluorescence of wild-type (black) and top1Δ (green) cells (n = 200 for each data point). (H and I) The time after meiotic induction (H) and the duration of the time interval (I) in which the DSB signal was above half the maximum value for wild type and top1Δ in three experiments. Error bars in I are SD. P = 0.07, unpaired t-test.

