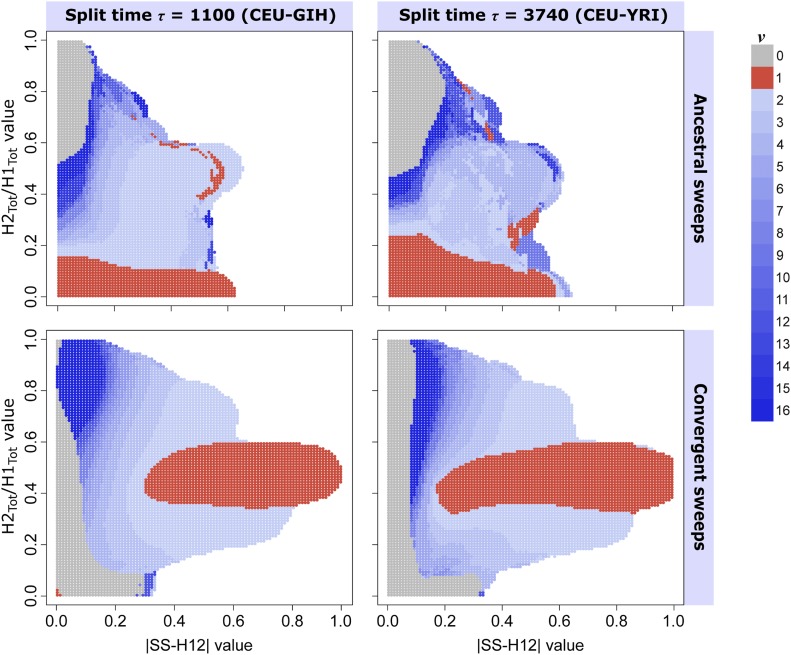
Figure 5.
Ability of paired values to infer the most probable number of sweeping haplotypes ν in a shared sweep. Most probable ν for each test point was assigned from the posterior distribution of sweep replicates with , drawn uniformly at random. (Top row) Ancestral sweeps for the CEU-GIH model (, coalescent units, left) and the CEU-YRI model (, coalescent units, right), with ( coalescent units, left) and ( coalescent units, right). (Bottom row) Convergent sweeps for the CEU-GIH model (left) and the CEU-YRI model (right), with ( coalescent units, left) and ( coalescent units, right). Colored in red are points whose paired values are more likely to result from hard sweeps, those colored in shades of blue are points more likely to be generated from soft sweeps, and gray indicates a greater probability of neutrality. Regions in white are those for which no observations of sweep replicates within a Euclidean distance of 0.1 exist.

