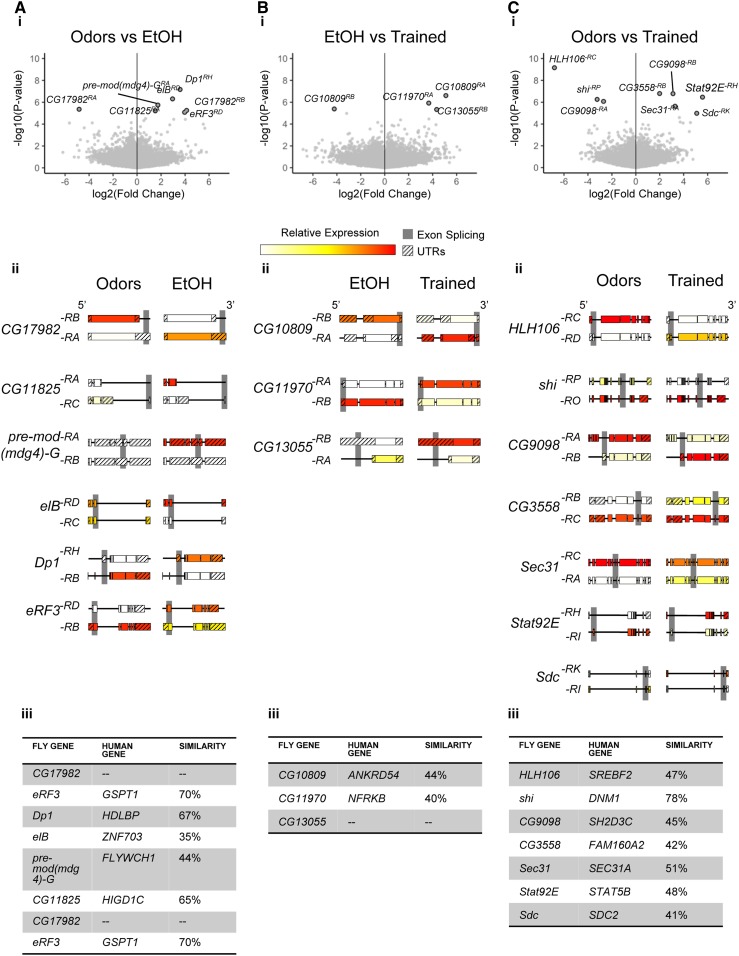
Figure 3.
Differential transcripts in particular pairwise treatment comparisons. (Ai–Ci) Volcano plots depicting (A) how EtOH differentially affects transcript expression compared to odors, (B) how Training (ethanol-odor pairing) differentially affects transcript expression compared to EtOH alone, and (C) how Training (ethanol-odor pairing) differentially affects transcript expression compared to Odors alone (dark outline, FDR < 0.05). (Aii–Cii) Significantly altered transcripts are depicted alongside the most highly expressed isoform of the same gene, gray shaded regions denote sequence differences between isoforms. (Aiii–Ciii) Transcripts are listed, along with the corresponding highest DIOPT-scored human genes. FDR, false discovery rate.

