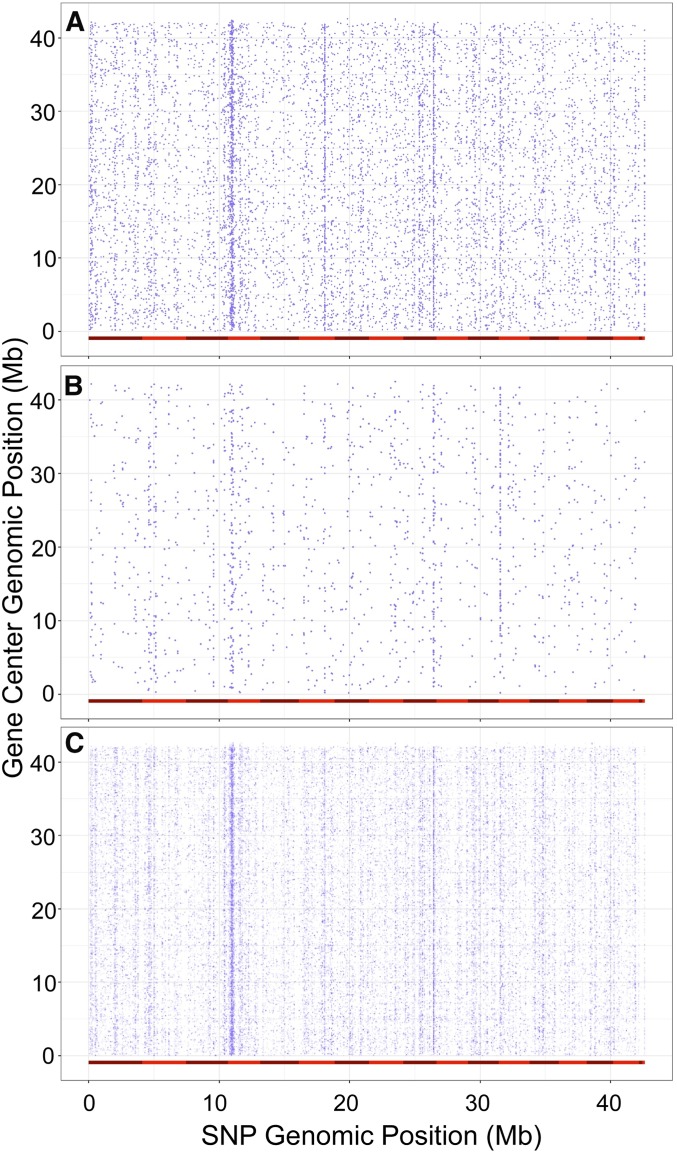
Figure 2.
Comparing B. cinerea gene center to position of top associated SNP. For all 9267 transcripts mapped to the B. cinerea genome, we retained only the SNPs with highest probability (lowest P-value) of significant effect on expression for each transcript. (A) The single top SNP per all transcripts. (B) The single top SNP for only those transcripts that have at least one SNP crossing the 1.96e−5 significance threshold. (C) The top 10 SNPs per all transcripts. The 18 chromosomes of B. cinerea are delimited by differentially shaded red bars along the x-axis, while positions indicate individual SNPs. The y-axis depicts the same chromosome alignment, but positions are the center of each mapped transcript. Vertical striping of SNP positions indicates genomic locations of putative trans-eQTL hotspots.

