FIGURE 2.

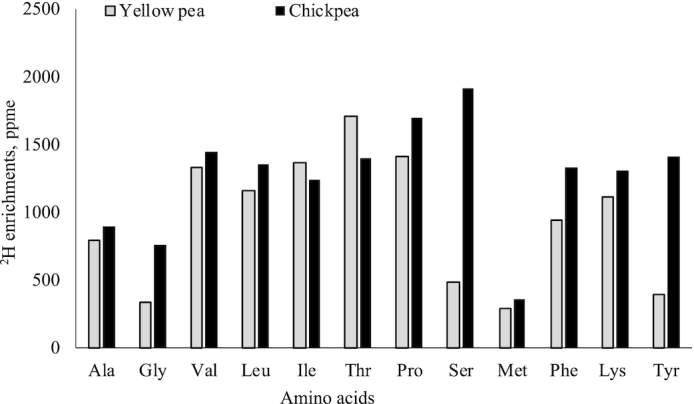
2H enrichments of intrinsically labeled yellow pea and chickpea seeds. Bars represents mean 2H enrichments of two replicates in ppme, parts per million excess.

2H enrichments of intrinsically labeled yellow pea and chickpea seeds. Bars represents mean 2H enrichments of two replicates in ppme, parts per million excess.