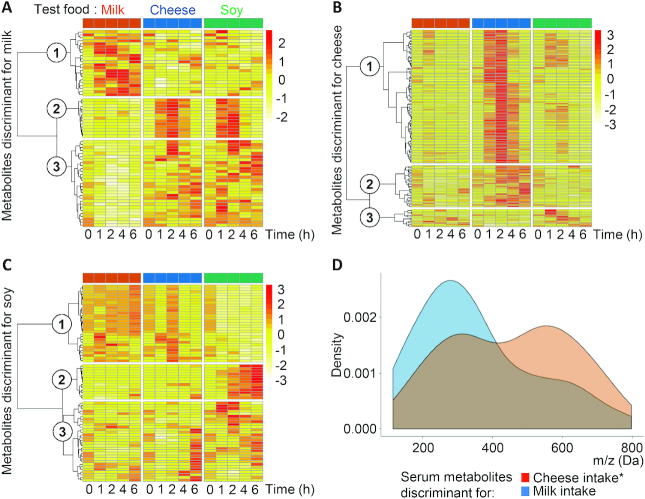
FIGURE 2.
Postprandial kinetics and mass distributions of metabolites discriminant for milk, cheese, or soy drink intake in serum of healthy adults (n = 10). Metabolites discriminant for milk (A), cheese (B), and soy drink (C) intake were selected by 1-by-2 OPLS-DA analysis (VIP score >1.5 as the significance threshold). Hierarchical clustering analysis according to postprandial kinetics after the intake of each of the 3 foods was performed using Maximum's distance measure and Ward linkage. The circled numbers 1 to 3 in the figures refer to the cluster numbering. Mass distribution density plots of discriminant metabolites (D) were compared using the Kolmogorov-Smirnov test. *Significant difference between mass distributions (P < 0.05). OPLS-DA, orthogonal projections to latent structures discriminant analysis; VIP score, variable importance in projection for the predictive component.

