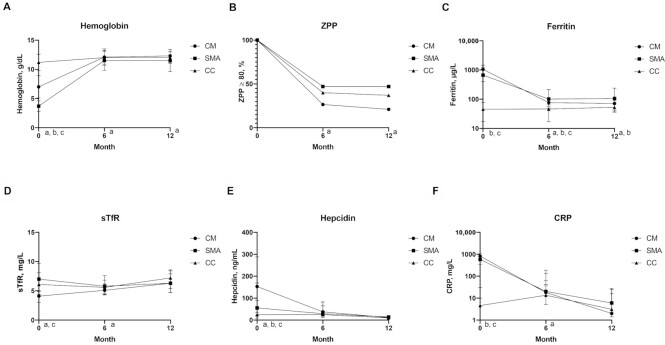
FIGURE 3.
Value of biomarkers or proportion by month and study group for all children who were randomly assigned to iron [all CM (n = 79), all SMA (n = 77), and CC who were iron-deficient at day 0 (n = 35)]. (A) Hemoglobin, (B) ZPP, (C) ferritin, (D) sTfR, (E) hepcidin, (F) CRP. Hemoglobin values are presented as the mean value at each time point; bars represent SD. Other biomarker values are the median value; bars represent IQR. Superscripts reflect significant differences (P < 0.05) at each time point as assessed by ANOVA for continuous outcomes, with Tukey's test for pairwise comparisons. All values aside from hemoglobin were log transformed before ANOVA. Differences in the proportion iron-deficient by ZPP (B) were determined by chi-square test. aDifference between SMA and CM; bdifference between SMA and CC; cdifference between CM and CC. CC, community children; CM, cerebral malaria; CRP, C-reactive protein; SMA, severe malarial anemia; sTfR, soluble transferrin receptor; ZPP, zinc protoporphyrin.

