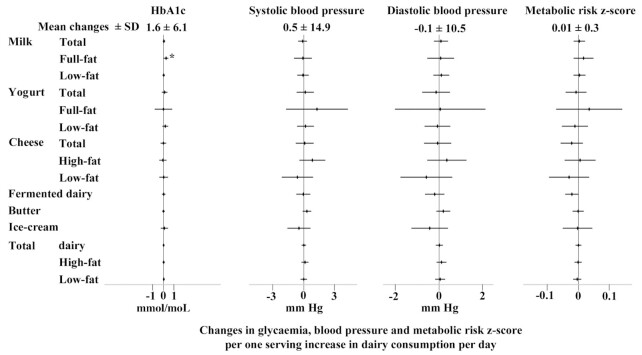
FIGURE 3.
Associations of increases in dairy consumption (by 1 serving/d) with changes in glycemia (HbA1c: n = 6224), blood pressure (systolic blood pressure: n = 14,210; diastolic blood pressure: n = 14,231), and the metabolic-risk z score (n = 6033) over an average of 3.7 y of follow-up. Mean ± SD changes presented in the top heading represent the average change in the markers over the follow-up. Forest plots represent linear regression coefficients with their 95% CIs adjusted for sociodemographic (age, sex, education, socioeconomic status), lifestyle (physical activity, smoking status), clinical (medication use, BMI), and dietary factors (total energy intake, food groups). *P < 0.05, **P < 0.01, ***P < 0.001. HbA1c, glycated hemoglobin; HDL-C, HDL cholesterol; LDL-C, LDL cholesterol.

