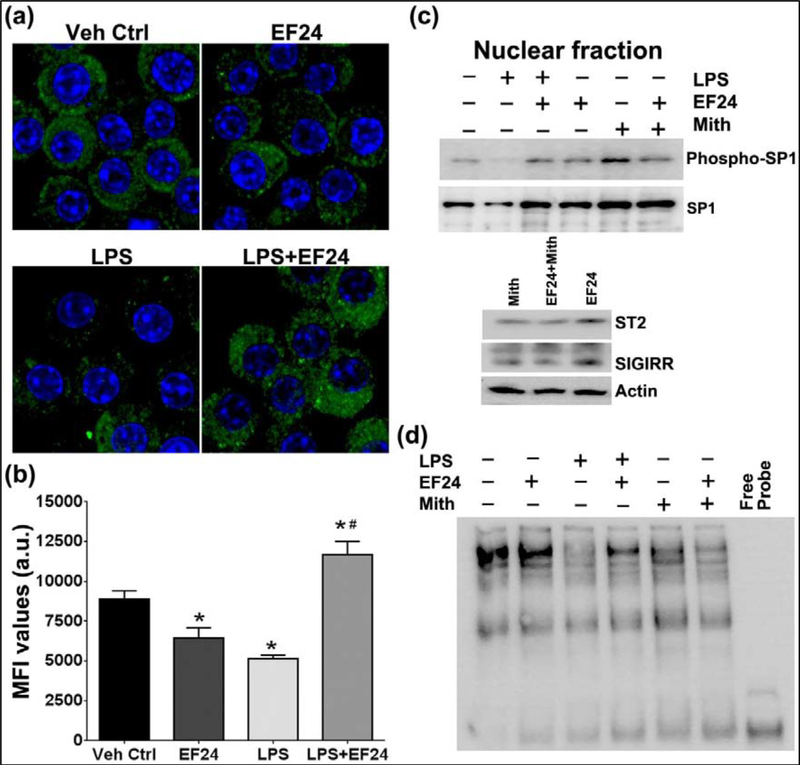
Figure 4.
EF24 treatment activates SP1 in LPS-stimulated DCs, but not in unstimulated DCs. (a) Confocal micrographs and (b) corresponding mean fluorescence intensity values for green fluorescence representing phosphorylated form of SP1. The nucleus was stained with Hoechst dye (blue). A representative set of images is shown. (c) Expression levels of phospho-SP1 and SP1 in the nuclear extract of dendritic cells (upper panel). Effect of mithramycin on EF24-induced ST2 and SIGIRR expression (lower panel). Mithramycin (Mith, 300 nM) was used as a control to specifically inhibit interaction of SP1 with its consensus DNA binding site. (d) Electrophoretic mobility shift assay showing induction of SP1activation by treatment of EF24 in LPS-stimulated DCs.

