
Figure 6. Fibrin content affects EC-MSC network formation and retention.
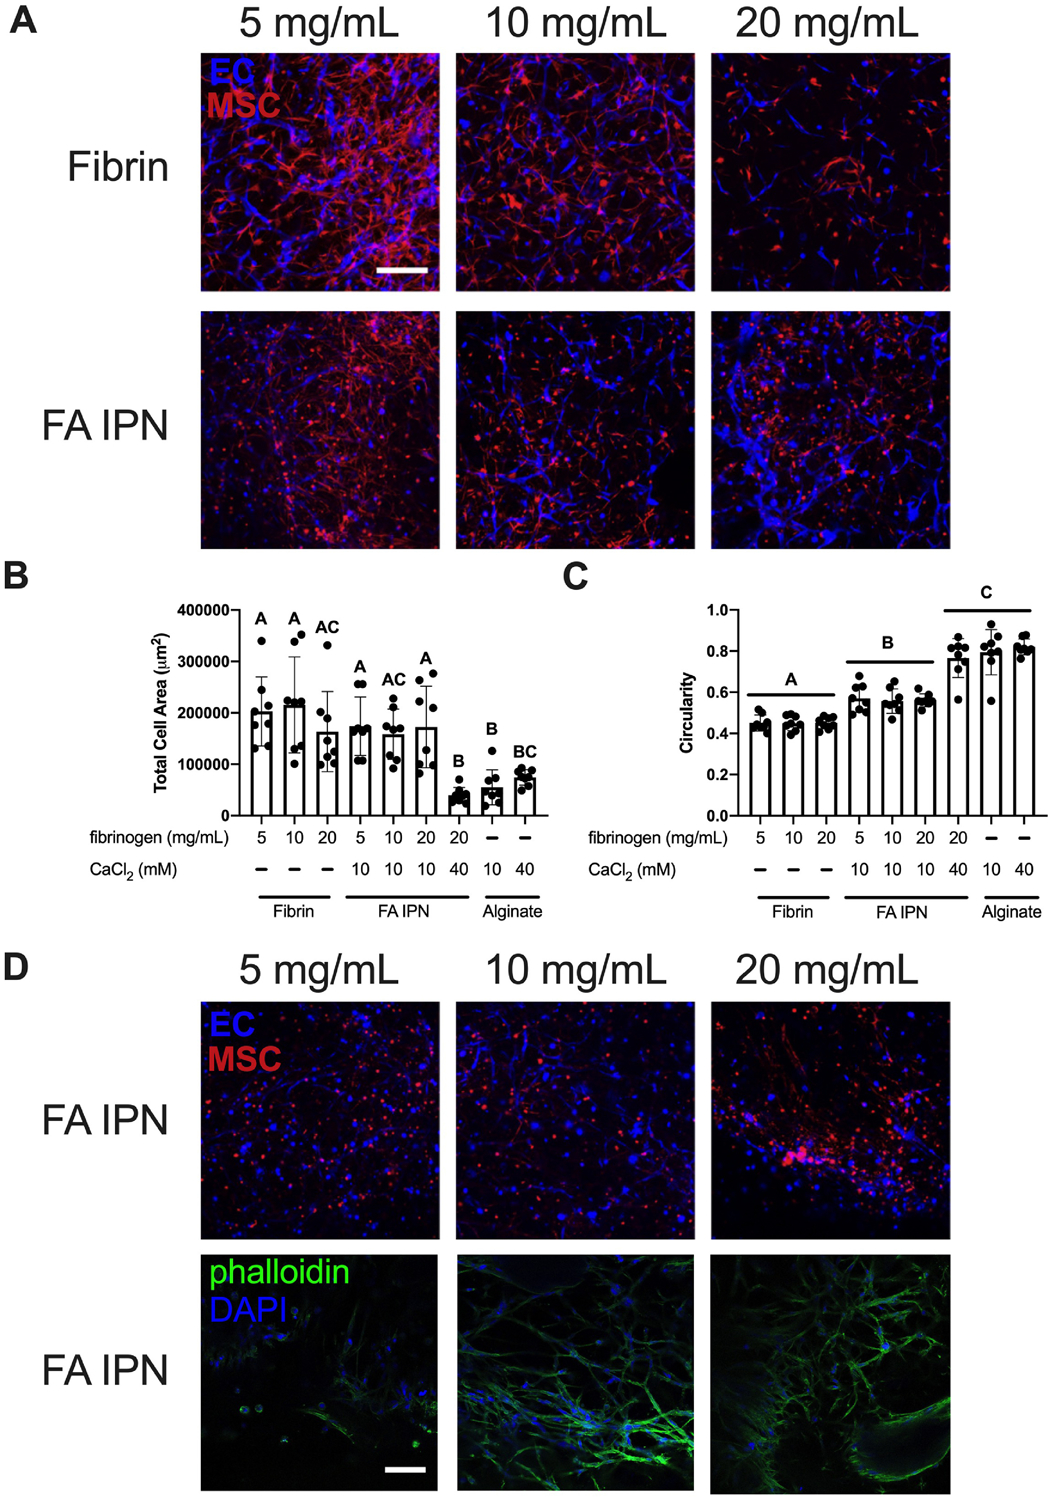
(A) Confocal images of ECs (violet) and MSCs (red) in FA IPNs with varying fibrinogen content on day 3 of culture. Scale bars are 250 μm. (B) Quantification of total area and (C) circularity (1.0 indicates a perfect circle) of ECs and MSCs in field of view on day 3 of culture (n=8). Different letters denote statistical significance (p<0.05). (D) Confocal images of ECs (violet) and MSCs (red) in FA IPNs (top) with respective phalloidin (green) and DAPI (violet) staining (bottom) on day 7. Scale bars are 250 μm.