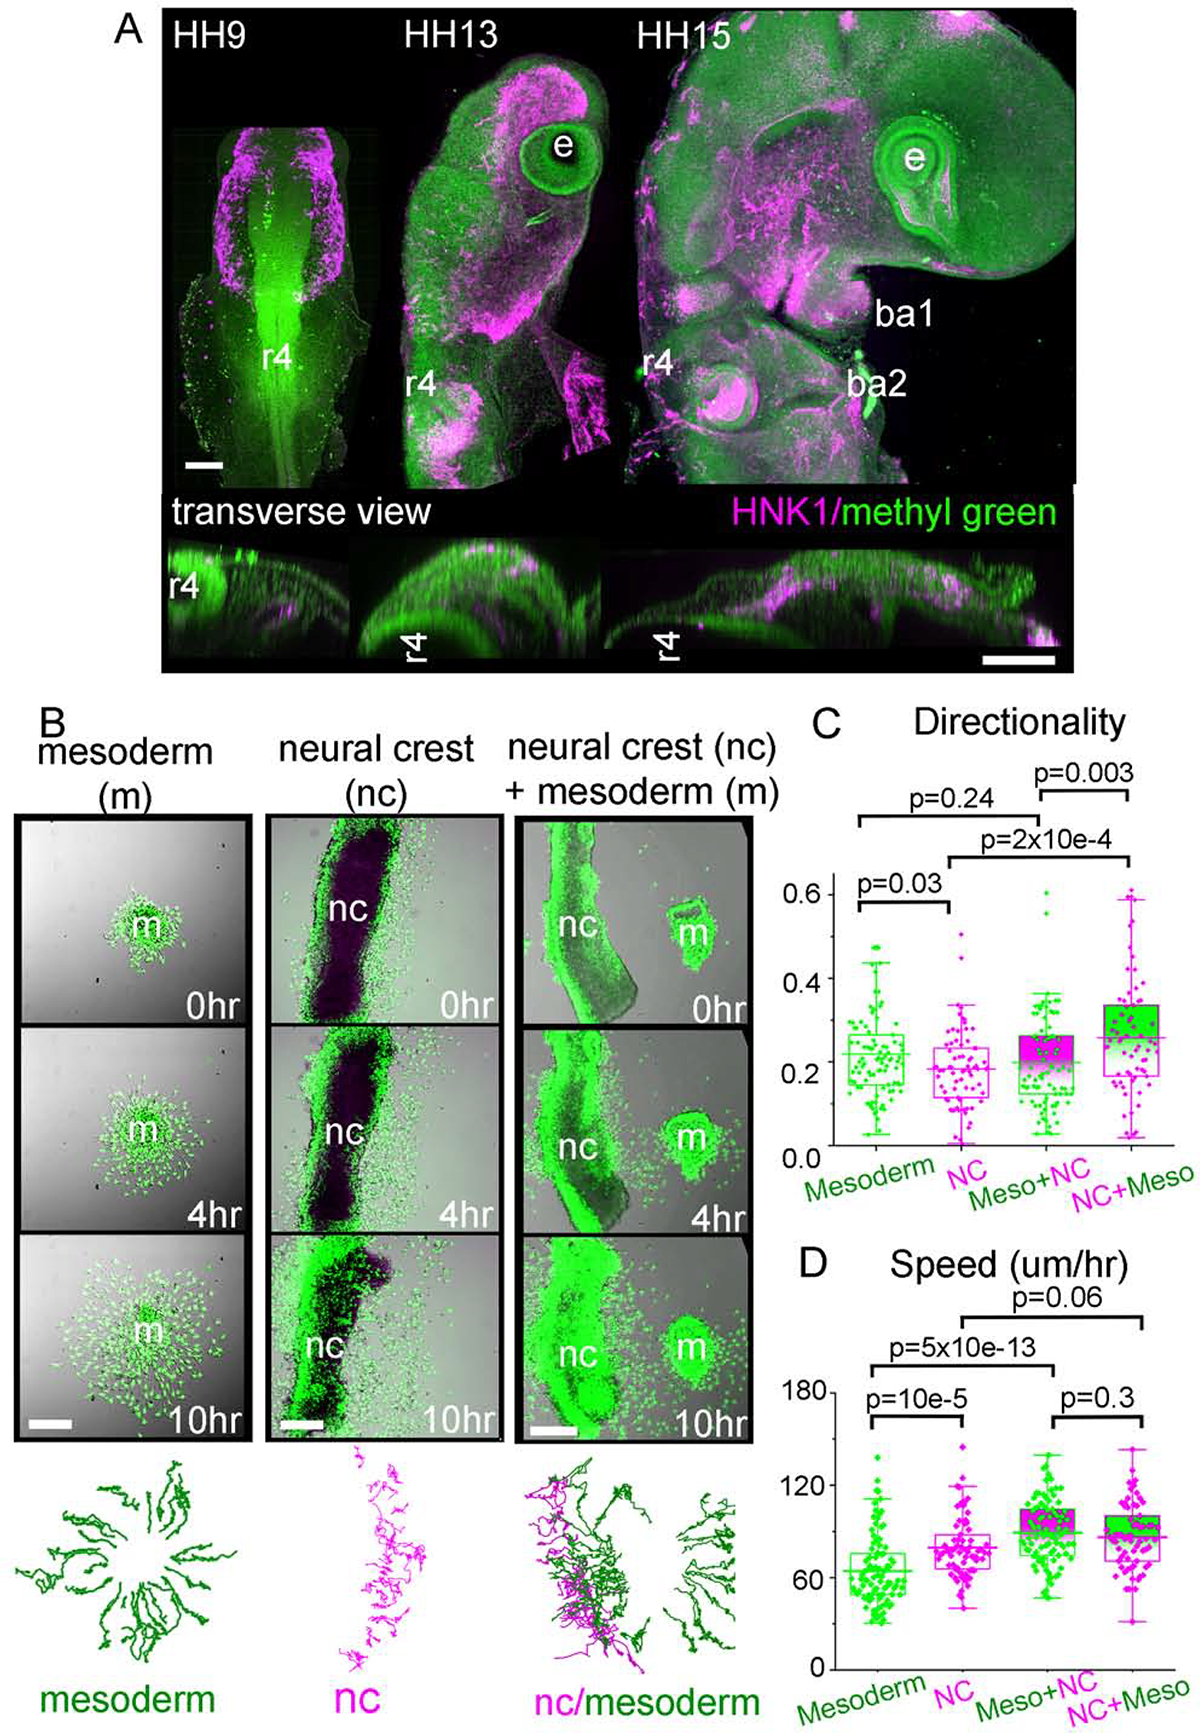
Figure 1: Growing chick embryo and mesodermal cell migration.

(A) Similarly scaled chick embryos between stages HH9 and HH15 showing the growth of the head. All nuclei (green) and neural crest (magenta) illustrate the increase in number of cells and size of the embryo over time. Upper images: lateral view, scale bar 150um. Lower images: transverse view at the level of r4, scale bar 50um. (B) Column 1: Mesodermal cells isolated from HH6–8 embryos grown in vitro. Final panel are tracks of individual cells over 10 hours. Column 2: Neural tube from HH11 embryo cultured. Final panel tracks of neural crest cells. Column 3: Neural tube from HH11 embryo co-cultured with mesoderm sample. Final panel are tracks of neural crest cells (magenta) and mesoderm (green). Scale bars 50um. (C) Directionality and (D) Speed of mesoderm only (green, n=5, 94 cells total), neural crest cells only (magenta, n=4, 73 cells), mesoderm cells in the presence of neural crest (green markers with magenta box, n=3, 91 cells) and neural crest in the presence of mesoderm (magenta markers with green box, n=3, 66 cells).
