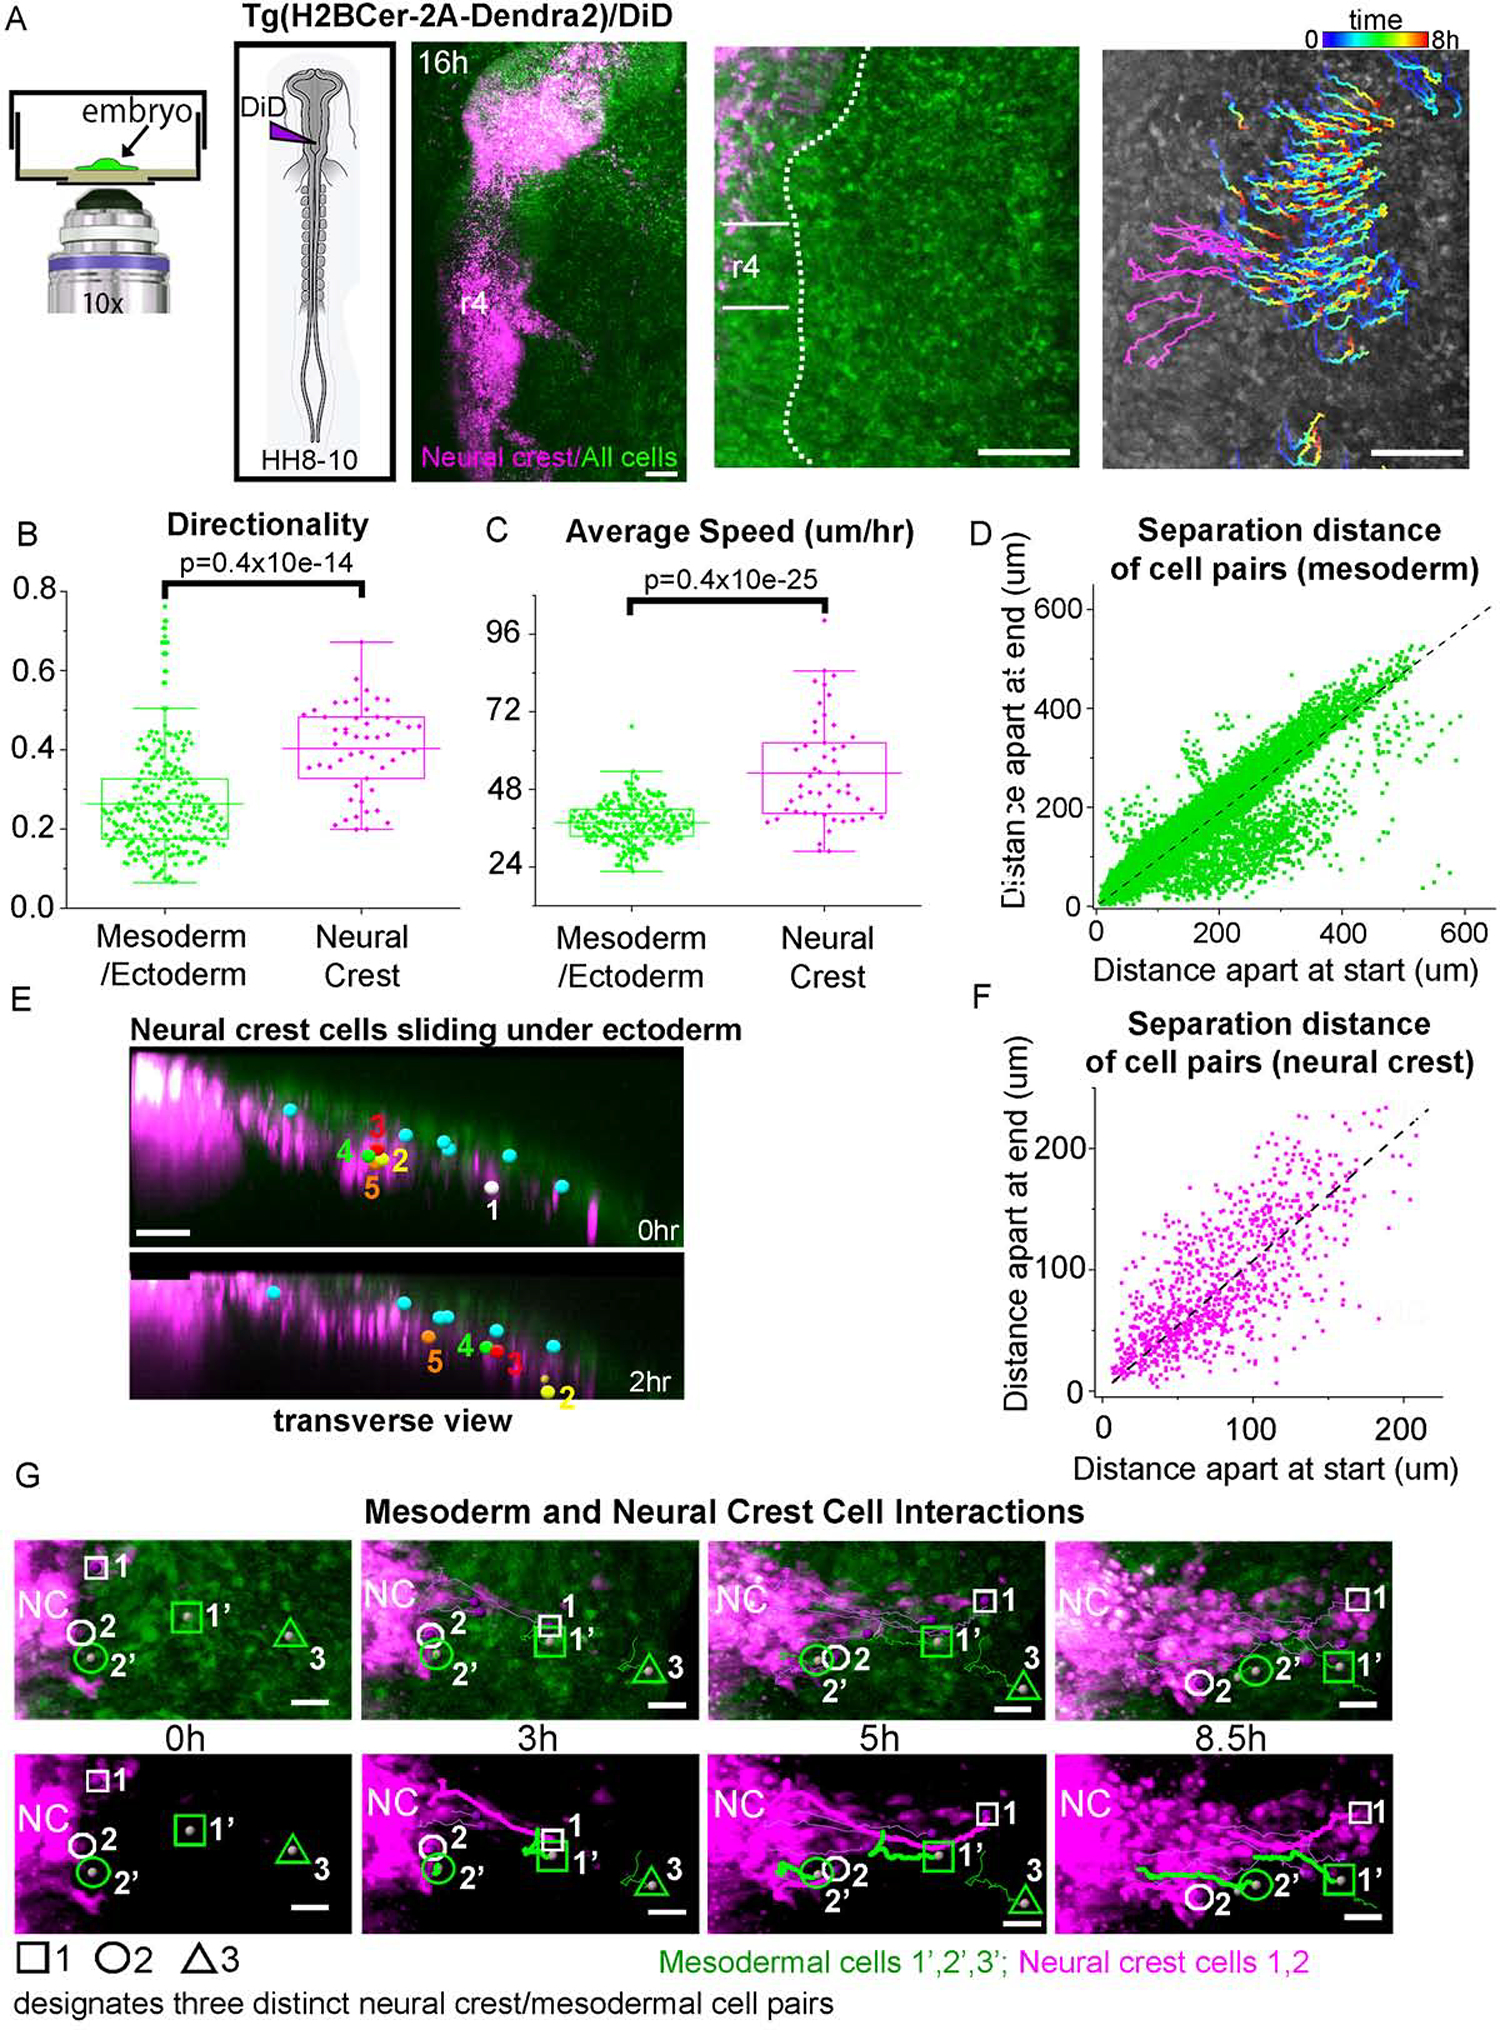
Figure 2: Neural crest cells are faster and more directed than the surrounding mesoderm in vivo.

(A) Schematic of a typical embryo mounted with EC culture media. Images of Dendra2 (green) transgenic quail roughly HH13 or 9 hours into a time-lapse session with DiD labeling of premigratory neural crest (magenta). First image of example time-lapse with r4 and edge of neural tube marked. First image overlayed with tracks of mesoderm/ectoderm cells colored by time and neural crest cells in magenta. Scale bars 100um. Directionality (B) and Speed (C) of neural crest, mesoderm and ectodermal cells. n=3 embryos each, 242 mesoderm/ectoderm cells and 74 neural crest. (D) Comparison of the separation distance between any two mesoderm cell pairs at the time of their first co-existence to their last observation, including pairs from different time-lapse movies. Straight line fit to data (dashed black). (F) Separation distance for neural crest only. (E) Transverse view of r4 at HH12. Individual ectoderm cells (cyan), neural crest cells (numbered) showing the relative speed of neural crest compared to the neighboring tissue over a 2-hour window. Scale bar 20um. (G) Series of images from a typical time-lapse movie showing interaction between neural crest (magenta) and mesodermal cells (green) over 8.5 hrs. Circles (neural crest). Squares and Triangle (mesodermal cells). Scale bar 20um.
