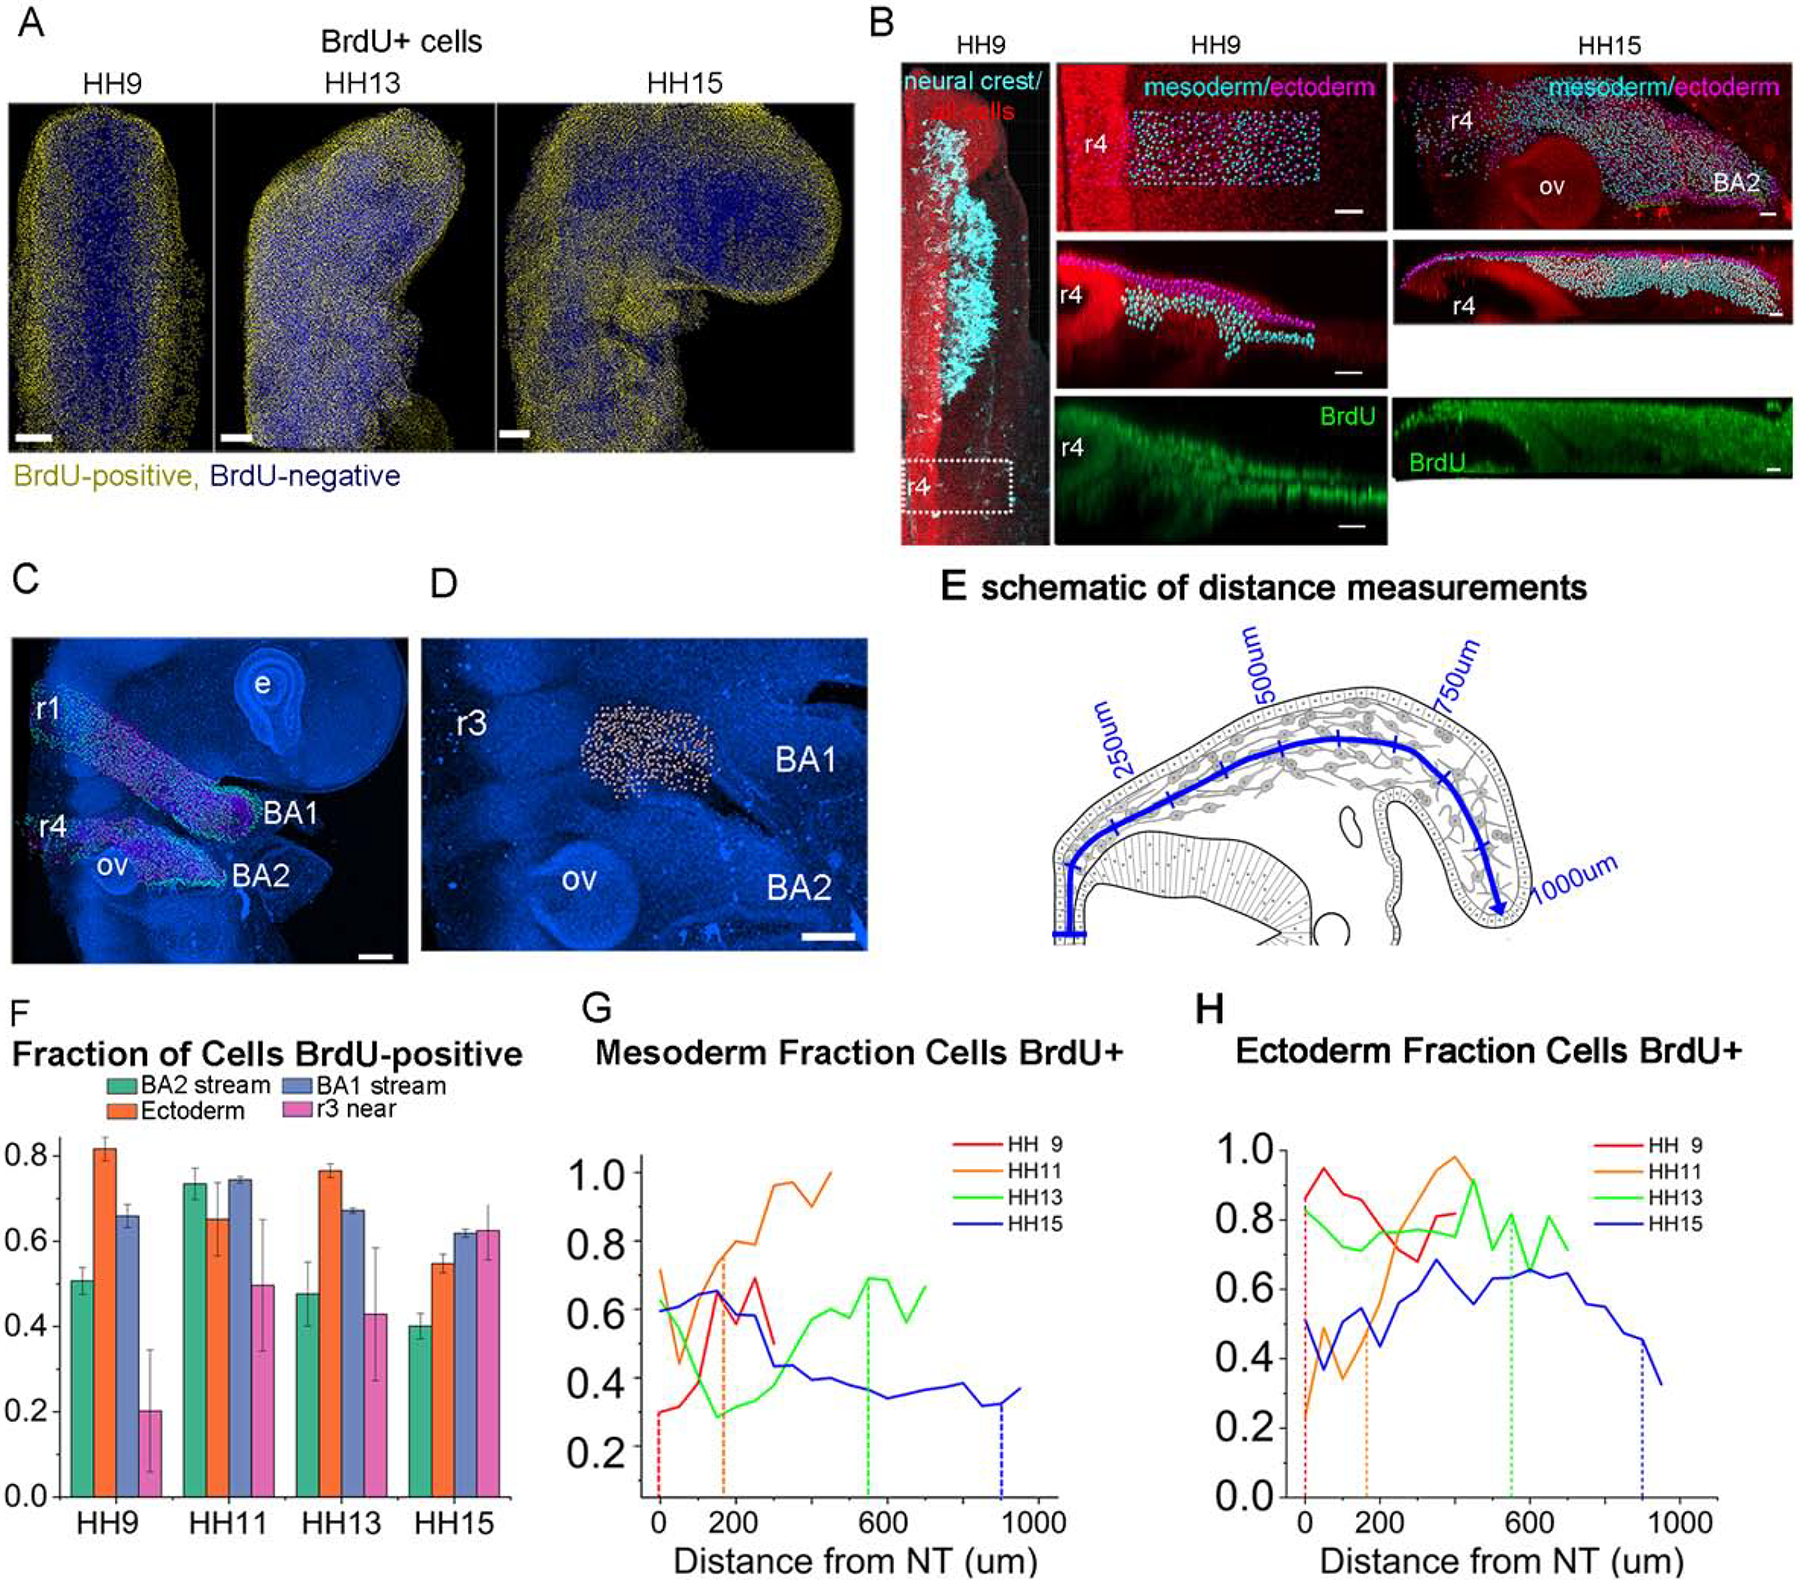
Figure 4: BrdU labeling of cells changes over time and throughout the tissue.

(A) Averaged images of embryos from HH9, HH13 and HH15 with yellow nuclei if the Brdu/methyl green intensity is in the top 40% of cells. Scale bar 100um. (B) HH9 embryo with nuclei (red), neural crest (cyan) and BrdU (green). Second column of images shows area in dashed rectangle with spots segmented on the methyl green channel indicating location in the mesoderm (cyan) or ectoderm (magenta). Third column, HH15 labeled similarly. Scale bar 40um. (C) HH15 embryo with ba1 and ba2 streams marked mesodermal cells (cyan) and ectoderm (magenta). Scale bar 100um. (D) Area lateral to r3 studied marked with white spots. Scale bar 100um. (E) Schematic of distance measurement from the neural tube curving along the neural crest pathway. (F) Fraction of mesoderm cells in ba1, ba2, ectoderm overlaying the ba2 stream, or cells adjacent to r3 domains that are positive for BrdU label in stages HH9-HH15 with SEM bars. (G) Fraction of mesoderm cells BrdU-positive in 50um bins along the domain of r4 to the end of ba2. Dashed vertical lines represent the front of the neural crest stream. (H) Fraction of ectoderm cells BrdU-positive in 50um bins along the domain of r4 to the end of ba2.
