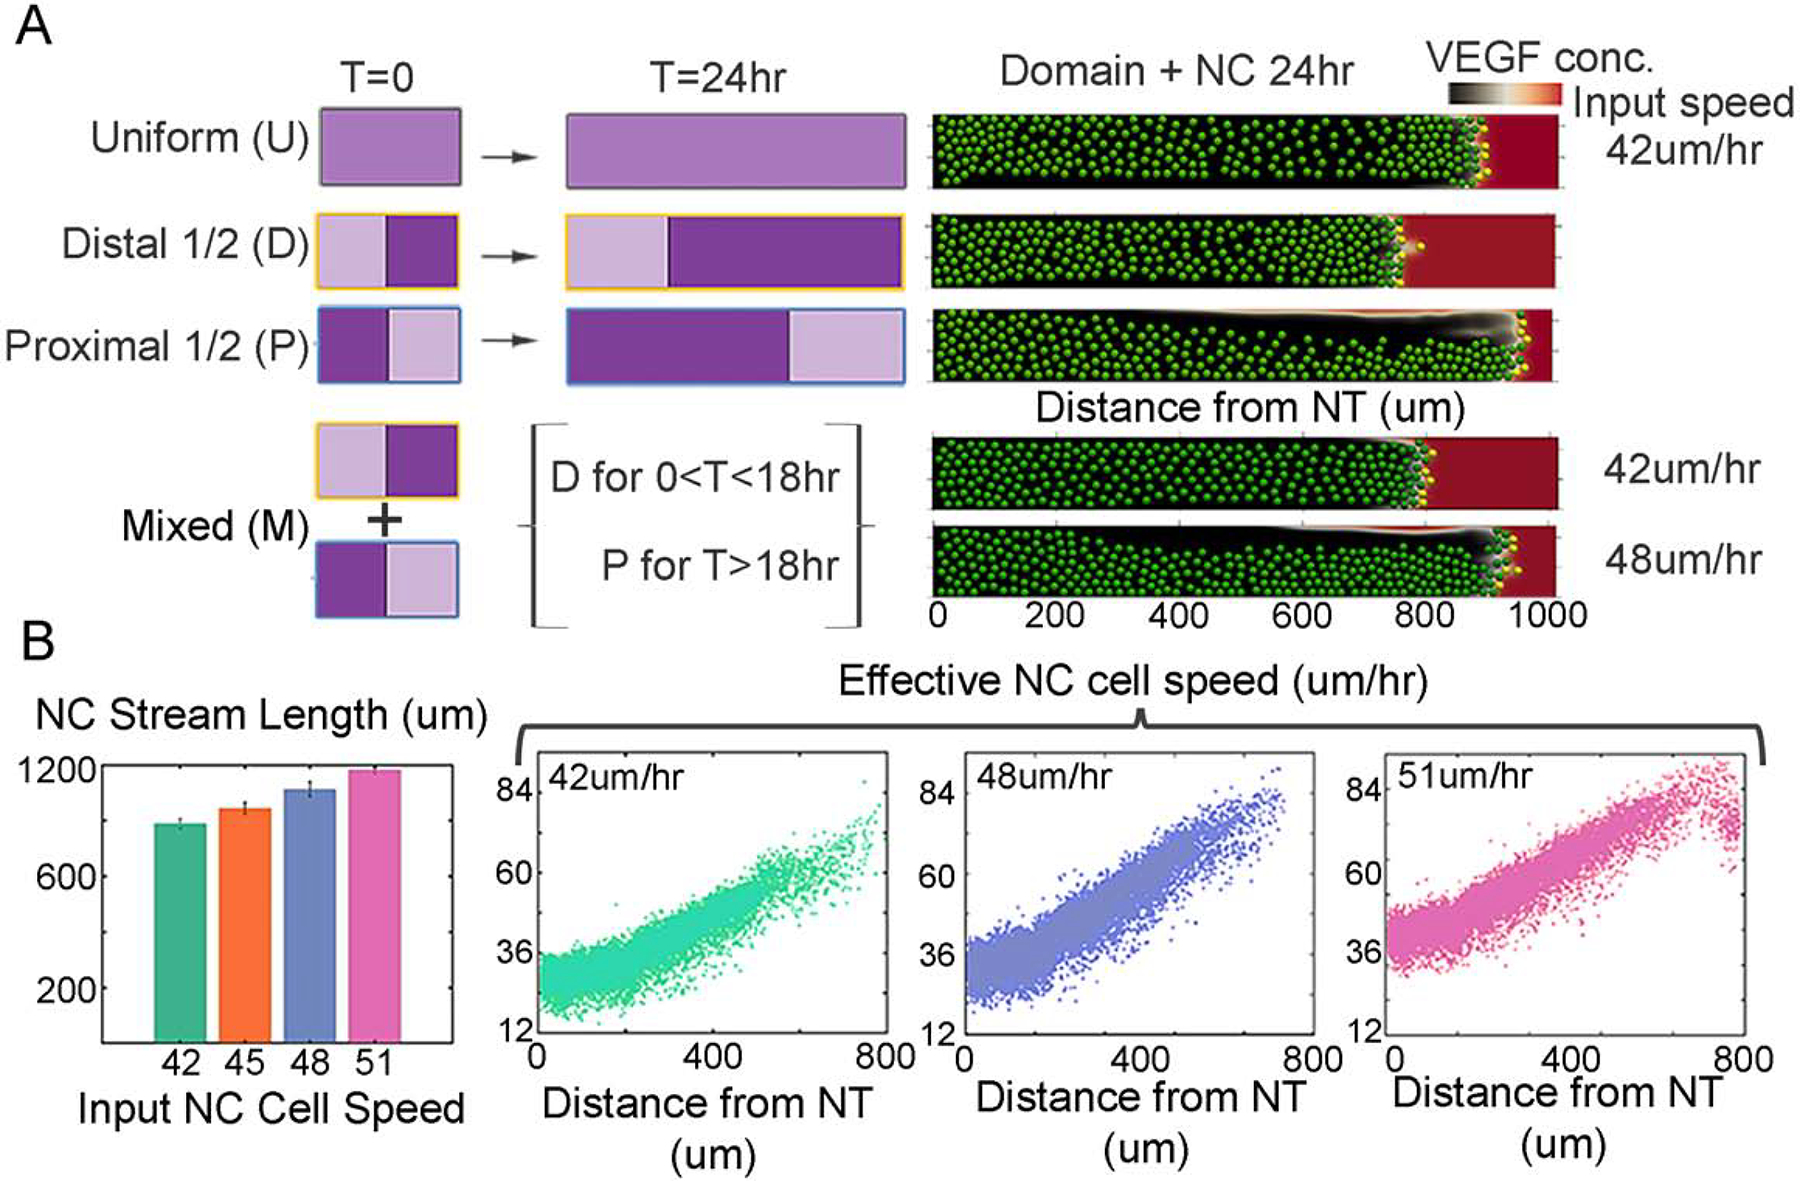
Figure 6: Modeling simulations of non-uniform tissue growth and the neural crest cell migratory pattern.

(A) Schematics of tissue growth profiles. Darker color indicates a higher growth rate. The growth rate is doubled for half of the domain in models D and P. As the cells migrate into the domain, they are advected at different rates and also contribute individual velocity to reach the end of the domain. Right, example of final distribution of cells (green) on a domain with chemoattractant concentration (red/black color bar). Model M combines proximal (P) and distal (D) growth profiles such that for less than 18 hours embryonic time the domain follows model D and from time greater than 18 hours the model follows growth profile P, with input cell velocity of 42um/min. (B) Left: Length of the simulated neural crest cell migratory stream at 24hrs using different input cell speeds (42,45,48,51 um/hr). Right: neural crest speed throughout the domain with different input speeds (42,48,51 um/hr) as cells are also advected with the domain growth.
