
Fig. 3.
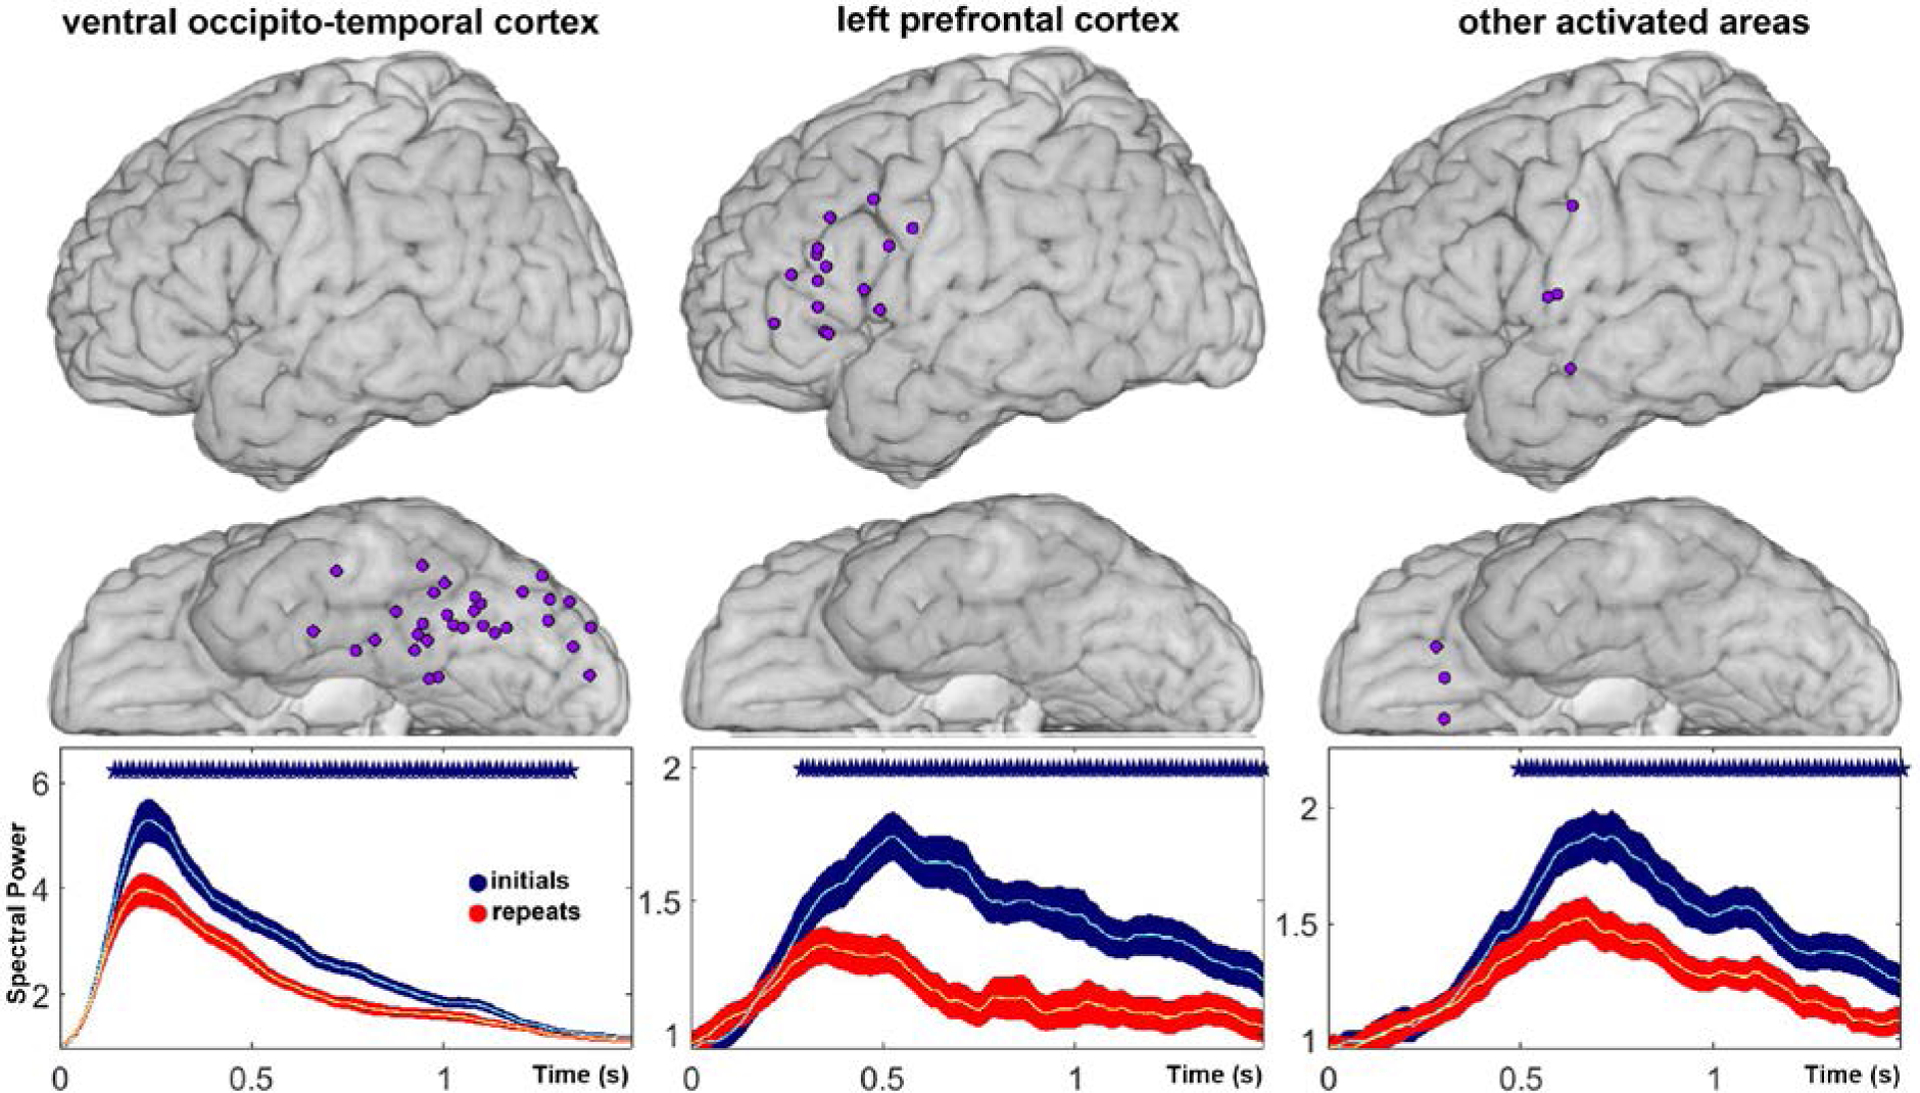
Mean change in high gamma power relative to baseline power, aligned to stimulus onset, for novel trials (blue) and repeated trials (red), averaged over all sites with statistically significant repetition suppression (RS) in ventral occipito-temporal cortex (VOTC), left prefrontal cortex (LPFC), and other activated sites (OAS). Recording sites included in the analysis are depicted above each plot. X-axis represents time in seconds. Y-axis represents mean power. Asterisks indicate time points at which power changes during novel and repeated trials were significantly different (p < 0.05, two-sided t-test with FDR correction).