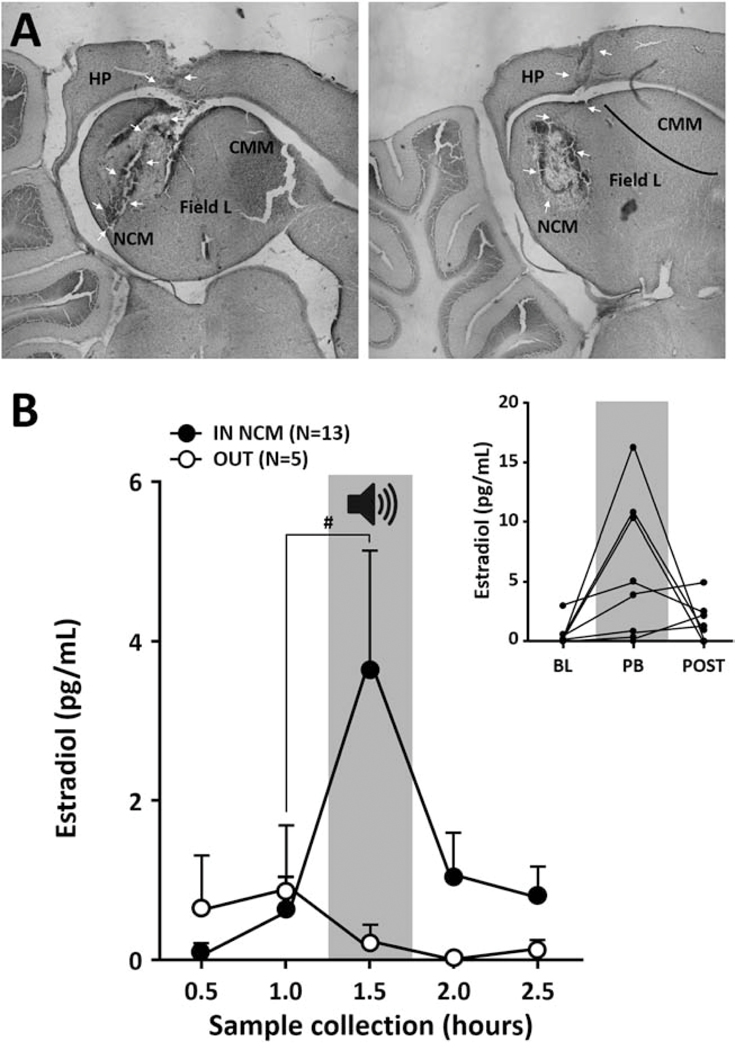
Figure 3:
Forebrain NCM E2 fluctuations during song exposure. (A) Photomicrographs showing microdialysis probes located inside NCM (medial NCM for the left picture, lateral NCM for the right picture), with the tip of the probe targeting the caudal part of NCM enriched with aromatase. (B) Acoustic playback (PB; gray area; 30 minutes duration centered on 1.5 hour) induces a significant increase in E2 levels within NCM. Average E2 level measured in samples collected every 30 minutes in females with a probe inside NCM (IN NCM) or outside of the region (OUT) under silent conditions (no color) or during playback (gray area) (Mean ± SEM). (Inset) Individual data of E2 level for animals with a probe positioned inside NCM during baseline (BL), playback (PB) and after the end of the stimulus (POST). # p = 0.055.

