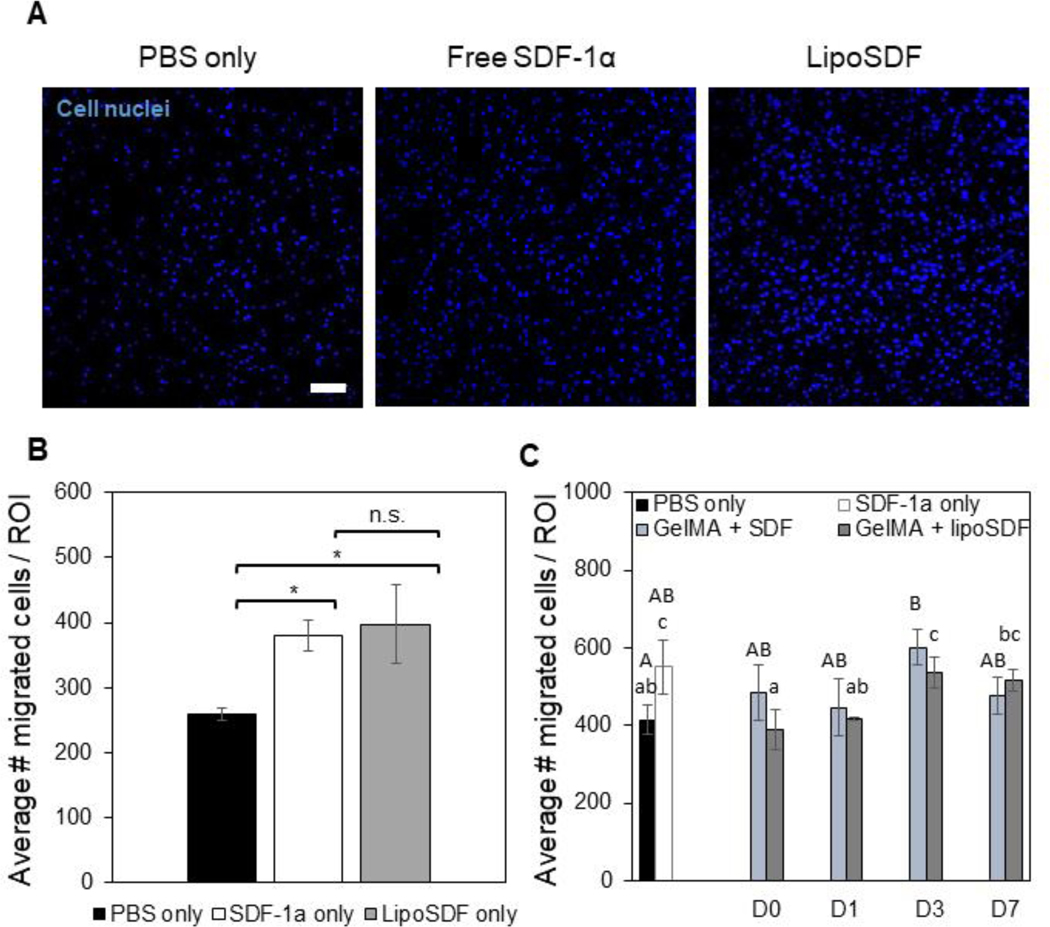
Figure 5: Liposomal encapsulation does not impair the chemotactic activity of SDF-1α and is able to induce chemotaxis for up to 1 week.
(A) Representative images and (B) quantitative cell counts from Hoechst-stained MSCs in a region of interest (ROI) that have migrated through a transwell membrane in response to the respective chemotactic factor: PBS, 80 ng/mL of free or liposomal SDF-1α (Scale bar: 100 μm. n = 3, mean ± STD. One-way ANOVAs with Tukey’s post-hoc comparisons, *p < 0.01). (C) Comparison of MSC migration in response to media conditioned over 1 week by PBS, 80 ng/mL SDF-1α, or either 5 μg/mL of free or liposomal SDF-1α in 10% GelMA. Two sets of one-way ANOVAs with Tukey’s post-hoc comparisons were conducted between groups (groups being compared are denoted by either upper- or lower-case letters). Groups that do not share a letter are statistically different (p < 0.05).

