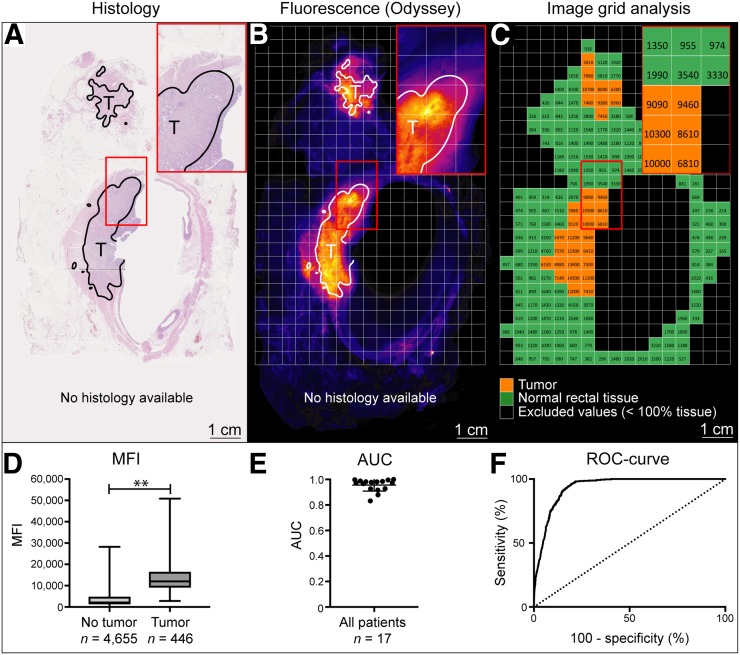
FIGURE 3.
Fluorescence grid analysis. All tumor tissue was delineated on hematoxylin–eosin staining (A) and subsequently overlaid on high-resolution fluorescence images of tissue slices (B). Each 3- by 3-mm square was selected as tumor-positive (C, orange) or tumor-negative (C, green). MFIs were calculated per square, with significantly higher fluorescence intensities in tumor tissue than in surrounding nontumor tissue (12,000 vs. 2,140; P < 0.001) (D). Individual areas under curve (AUC) were determined per patient (E), and receiver operating characteristic (ROC) curve was plotted, showing AUC of 0.94 (F).

