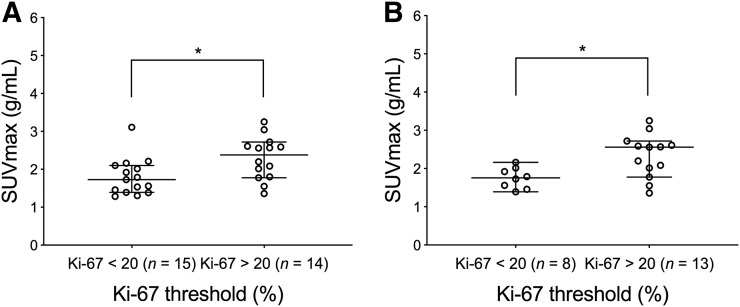
FIGURE 3.
Plot of SUVmax in groups stratified by Ki-67 below or above 20. (A) SUVmax shows significant difference between patient tumors stratified by low (n = 15) and high (n = 14) Ki-67 values in all 29 tumors. (B) SUVmax stratified by low (n = 8) and high (n = 13) Ki-67 values restricted to IDC (n = 21) show significant differences based on Ki-67 threshold. Center line of each distribution indicates median value; error bars show 95% confidence interval of median. *P < 0.05.

