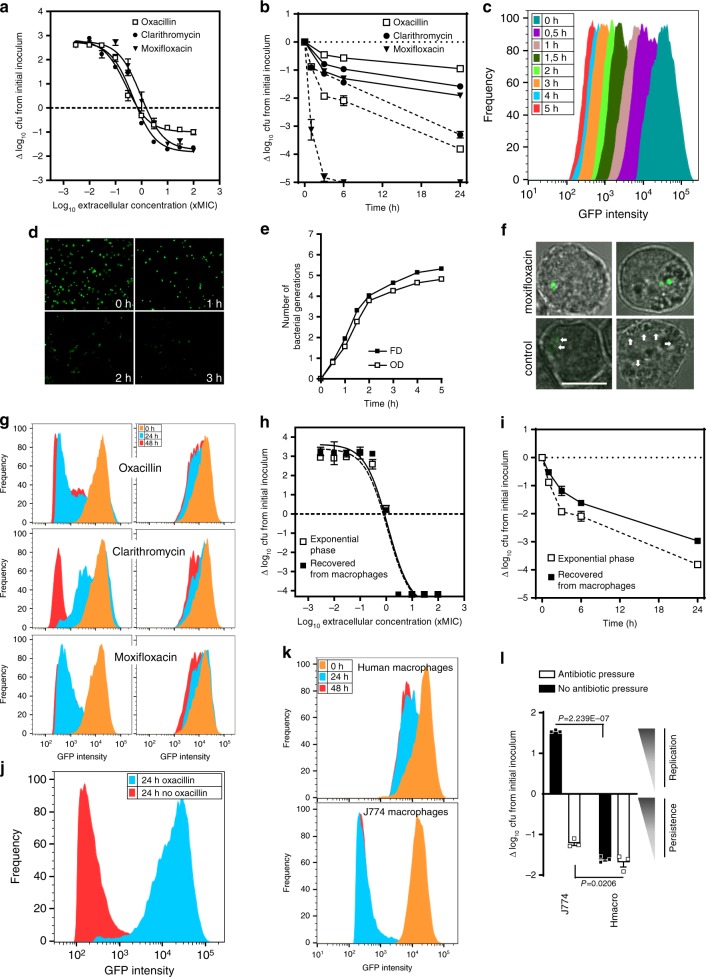
Fig. 1. Evidence and dynamics of intracellular persisters of S. aureus.
a Antibiotic activity against S. aureus infecting J774 macrophages exposed to increasing concentrations of antibiotics for 24 h (data expressed as log10 cfu reduction from postphagocytosis inoculum). b Time-kill curves against S. aureus infecting J774 macrophages (solid lines) or in exponential phase culture (dotted lines) exposed to 50x MIC of antibiotics for the indicated periods. c Fluorescence dilution (FD) experiment with S. aureus expressing inducible GFP. Bacteria washed from inducer at the entry of exponential phase were grown in fresh broth. The graph shows flow cytometric profiles of the frequency of events as a function of GFP intensity over time. d Corresponding images in epifluorescence microscopy. e Corresponding bacterial replication curves determined by FD and OD620nm (OD), which displayed similar doubling times (e.g., 27 min and 28.7 min between 1 h and 2 h, respectively; N [number of generations]). f Confocal microscopy of infected J774 macrophages exposed to 50x MIC moxifloxacin or under control conditions (2x MIC gentamicin) for 24 h. Arrows: bacteria with diluted signal (bar: 10 μm). g Flow cytometric profiles of bacteria recovered from macrophages exposed to 2×(left) or 50x MIC (right) of each antibiotic for the indicated periods. h, i Activity of oxacillin (h, concentration-effect at 24 h; i, time-kill curve with 50x MIC oxacillin) in broth, against an exponential phase culture (open symbols) or bacteria recovered from macrophages exposed to 50x MIC oxacillin for 24 h (closed symbols). j Flow cytometric profiles of bacteria recovered from macrophages exposed to 50x MIC oxacillin for 24 h (blue), then washed from oxacillin and reincubated in control conditions (2× MIC gentamicin) for an additional period of 24 h (red). k Flow cytometric profiles of bacteria recovered from control (2x MIC gentamicin) J774 and human macrophages for the indicated periods. l Intracellular inoculum in infected J774 and human macrophages incubated for 24 h with 50× MIC oxacillin or in control conditions (2× MIC gentamicin). Statistical significance was determined by two-tailed Student’s t-test. Data are means ± SEM (a, b, h, i, l) or representatives results (c, d, e, f, g, j, k) of three independent experiments. a, b, e, h, i, l, Source data are provided as a Source Data file.

